
Executive summary
- Non-connectivity revenues have been the key driver of revenue growth for the industry with a growth rate of 17.4 percent in 2022. This is significantly greater than the overall industry revenue growth rate of 6.7 percent.
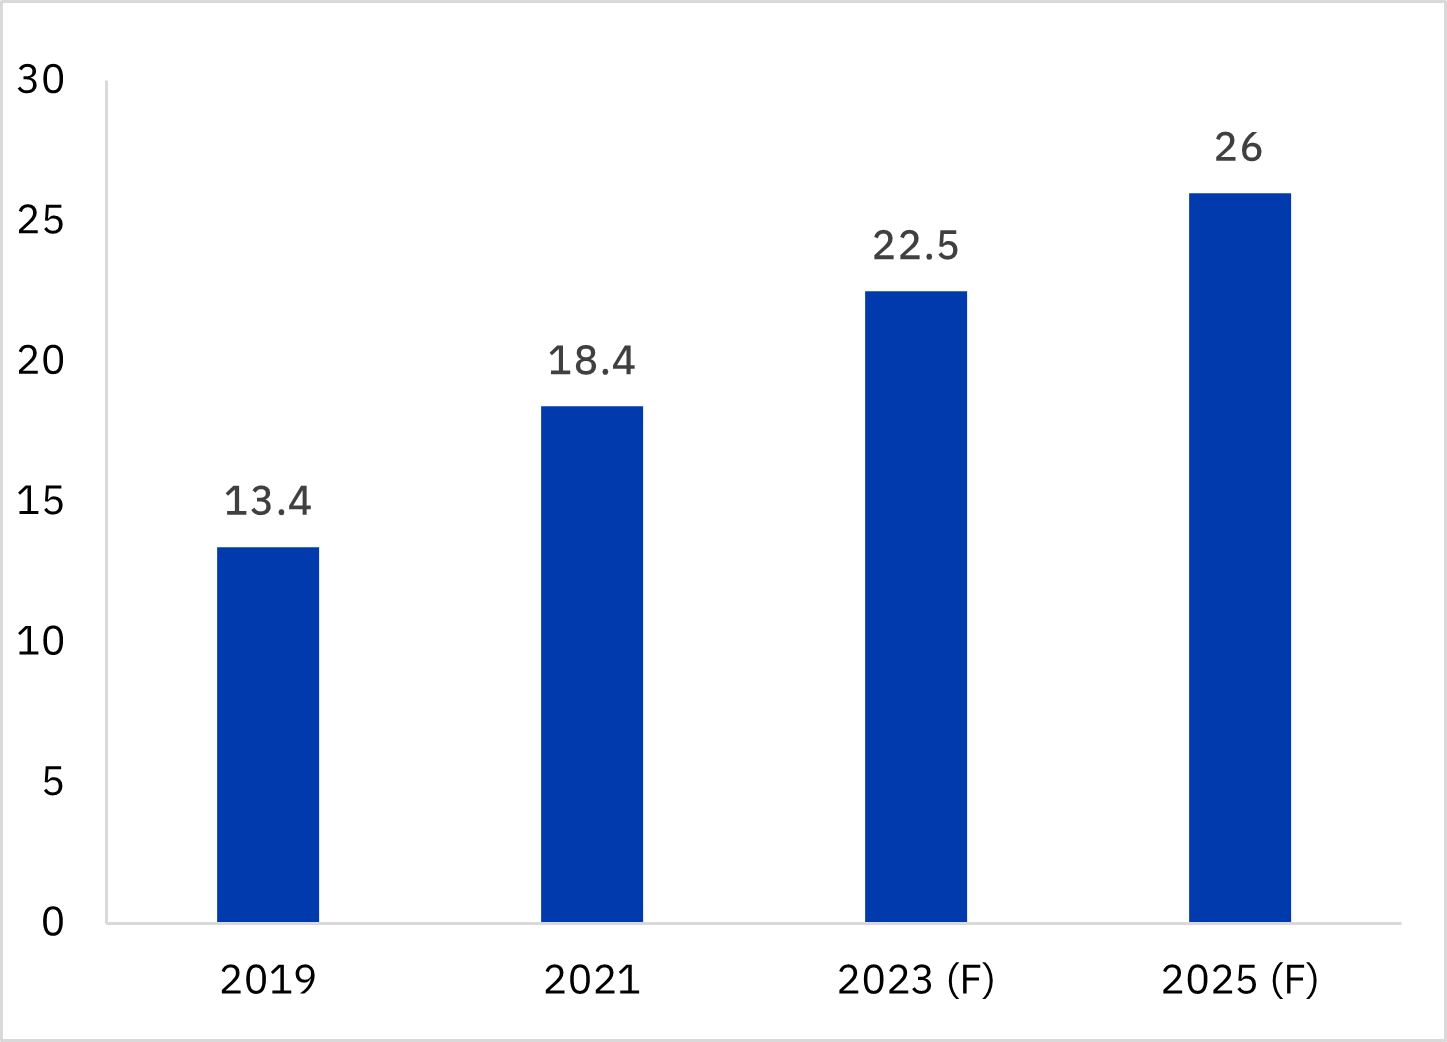
- In 2022, non-connectivity revenues accounted for 20.3 percent of total revenues, up from 18.4 percent in 2021. We forecast it to reach 26 percent of the total by 2025 as telcos aggressively transition to offer more digital and enterprise services.
- Six telcos have non-connectivity revenue contribution to total in excess of 25 percent. They all have expanded their revenue base to come from a diverse portfolio of services.
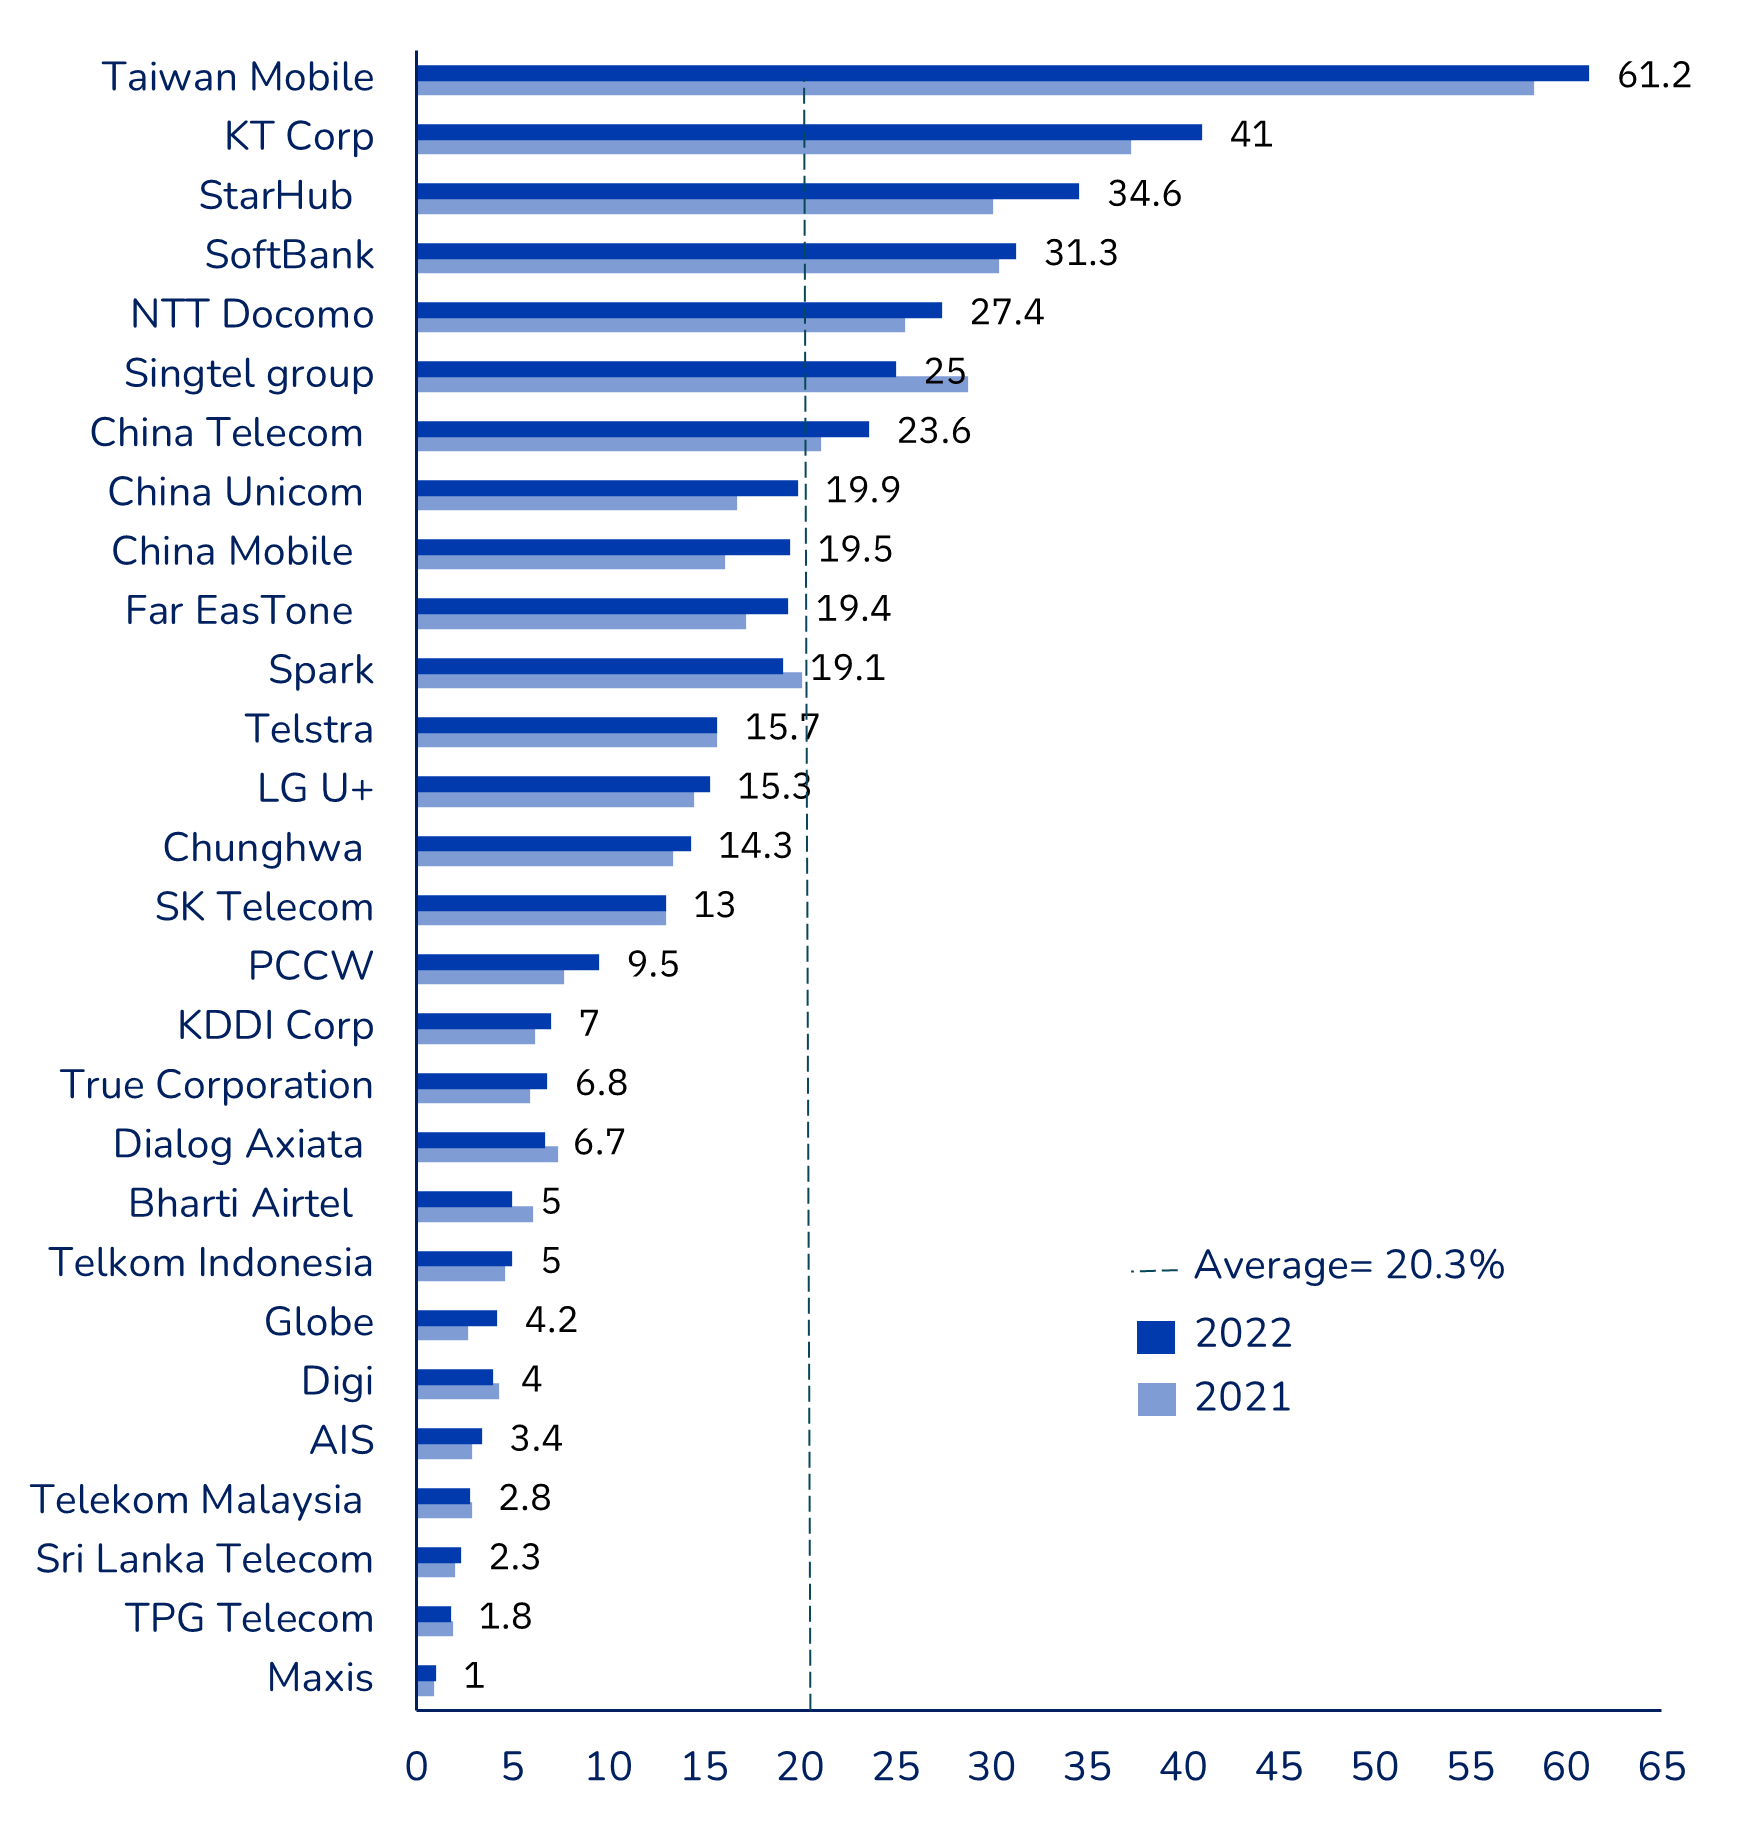
- With US$ 27.4 billion in revenue, China Mobile has the largest non-connectivity business among the 28 operators, representing 19.5 percent of total revenues. These revenues have grown at a rate of 33.2 percent, making it the second-fastest growing non-connectivity business of any telco.
- Taiwan Mobile continues to have the highest percentage of non-connectivity revenues to total at 61.2 percent.
- StarHub’s non-connectivity revenue as a percentage of total revenue increased from 30.1% in 2021 to 34.6% in 2022. This difference of 4.5 percentage points is the highest in the industry.
- Globe registered the highest growth rate in its non-connectivity revenues at 58.8 percent, which accounts for 4.2 percent of its total revenues.
Exhibit 1
Contribution of non-connectivity revenue to total revenue, 2022 (%)
Assumptions and methodology
- This report is based on the study of 40 telcos across Asia Pacific. Of these 40 telcos, 28 provide significant progress in establishing and reporting their non-connectivity business revenues.
- Non-connectivity services are defined as services excluding voice, fixed-line, broadband, and enterprise connectivity (IP-VPN, SD-WAN, etc.).
- These non-connectivity services were further classified into four pillars, namely enterprise non-connectivity, content & media, e-commerce, and others.
- We identified the top 10 telcos to ace non-connectivity revenues based on the twimbit growth index, viz., a combination of absolute non-connectivity revenue growth, the percentage change in non-connectivity revenues and non-connectivity revenues as a percentage of the total revenues in 2022.
twimbit’s 4 pillars of non-connectivity services
Telcos across Asia Pacific have identified and capitalized on four major opportunities. We call these twimbit’s 4 pillars of non-connectivity services
| E-commerce | The e-commerce industry is highly competitive, and success often hinges on being an early entrant. Telcos are utilizing their online portals and stores to drive their e-commerce business |
| Enterprise non-connectivity | Enterprise non-connectivity, which includes cloud services, managed services, IoT, and cyber security, is a crucial area for service providers, particularly with the advent of 5G. Many telcos have made notable progress in this segment. |
| Content & Media | Content and media, encompassing IPTV, pay TV, content leasing, and OTT services, has been successful in bundling content with broadband connectivity. Telcos are also pursuing partnerships with major streaming platforms such as Netflix, Amazon Prime, and Disney. |
| Other services | Telcos are demonstrating a strong interest in financial services, digital marketing, analytics, telehealth, and education, among other areas. Payment services are of particular interest, and telcos are leveraging their vast amounts of available data, which we have observed to have numerous potential use cases. |
The key takeaways from the review of the top telcos in Asia:
- 90% have expanded into enterprise non-connectivity services.
- 70% are involved in content and media.
- 10% of the telcos have ventured into e-commerce.
- 45% have diversified into various other services including payments, digital marketing, analytics, etc.
Non-connectivity will contribute to 26% of total revenues for telcos in Asia-Pacific by 2025
The percentage contribution of non-connectivity revenues to total has been steadily rising in the last five years. It has increased from 13.4 percent of total in 2019 to 20.3 percent in 2022. We expect an addition of between 2 to 3 percentage points annually in the coming years and forecast it to reach 26 percent of total by 2025.
Exhibit 3
Contribution of non-connectivity revenue to total revenue (%)
Twimbit’s top 10 operators to ace non-connectivity revenues.
Every year, we develop this list of top 10 Asia Pacific telcos to ace non-connectivity services. Since they all participate in different countries with varying maturity of market development, we have tried to normalize their performance by scoring them across three parameters, giving each parameter equal weightage.
- Absolute change in revenue from non-connectivity services between 2021 to 2022.
- Percentage change in non-connectivity revenues from 2021 to 2022.
- Revenue from non-connectivity services as a percentage of the total in 2022.
Exhibit 4
Top 10 telcos to ace non-connectivity revenues (NCR) in 2022
| Rank | Telco | NCR 2022 US$ million | NCR 2021 US$ million | Absolute change US$ million | percent change y-o-y | NCR percent of total |
| 1 | China Mobile | 27,369 | 20,544 | 6,825 | 33.2 | 19.5 |
| 2 | StarHub | 596 | 455 | 140 | 30.9 | 34.6 |
| 3 | China Telecom | 17,034 | 13,915 | 3,119 | 22.4 | 23.6 |
| 4 | China Unicom | 10,569 | 8,217 | 2,352 | 28.6 | 19.9 |
| 5 | Taiwan Mobile | 3,797 | 3,279 | 518 | 15.8 | 61.2 |
| 6 | KT Corp | 8,828 | 7,801 | 1,028 | 13.2 | 41.0 |
| 7 | SoftBank | 15,986 | 14,744 | 1,242 | 8.4 | 31.3 |
| 8 | NTT Docomo | 14,078 | 12,876 | 1,203 | 9.3 | 27.4 |
| 9 | Far EasTone | 623 | 527 | 95 | 18.1 | 19.4 |
| 10 | KDDI Corp | 3,431 | 2,905 | 526 | 18.1 | 7.0 |
| Top 10 total | 102,311 | 85,263 | 17,048 | 20.0 | 22.7 | |
| All APAC total | 115,552 | 98,456 | 17,096 | 17.4 | 20.3 |
Key insights from the leaders of non-connectivity services
#1 Chinese telcos are emerging as the role model for driving growth with enterprise 5G solutions
Chinese telcos lead the way in 5G industry use cases, with a combined total of over 49,000 applications across various industries. The telcos have made significant strides in cloud, IoT, and big data domains, redefining the traditional role of a telco in serving enterprise customers. Research and development have been the driving force behind their success, underscoring their focus on continuous innovation. The significance of these achievements is further highlighted in the exhibit 5 below.
Exhibit 5
Market measurements for Chinese telcos in Enterprise business
| Measurements | China Mobile | China Telecom | China Unicom |
| Value of enterprise business (excluding connectivity) | US$ 13.0B | US$ 14.5B | US$ 10.6B |
| IoT revenue | US$ 2.3B | US$ 0.6B | US$ 1.3B |
| Cloud revenue | US$ 7.5B | US$ 8.7B | US$ 5.4B |
| Big Data Revenue | US$ 0.5B | n/a | US$ 0.6B |
| Value of 5G projects | US$ 5.5B | n/a | US$ 0.5B |
| No. of 5G industry application projects | >18,000 | >15,000 | >16,000 |
| R&D investments | US$ 3.3B | US$ 1.6B | n/a |
China Mobile has continued to impress us with its exceptional growth and success across multiple segments. Despite operating at an enormous scale, the company has consistently demonstrated remarkable performance. Here are some key metrics that highlight its dominance:
- Generating the largest revenue in the Asia Pacific region, amounting to US$ 140.6 billion, growing at 10.5 percent YoY in 2022, exceeding the industry average growth rate of 6.7 percent.
- Leading the pack with the highest non-connectivity business revenue of US$ 27.4 billion among 28 operators, growing at 33.2 percent.
- Generating the highest revenue from enterprise business, totaling US$ 25.2 billion and growing at 22.6 percent. This is backed up by 23.2 million corporate customers, with a net addition of 4.3 million customers in 2022.
- Cloud revenue of US$ 7.5 billion, growing at an astonishing rate of 108 percent signing over 6,200 major contracts for cloud services as of 2022.
- Entered over 18,000 agreements for 5G commercial projects by the end of 2022, generating over US$ 5.5 billion in revenue.
#2 StarHub aces growth with emphasis on enterprise business
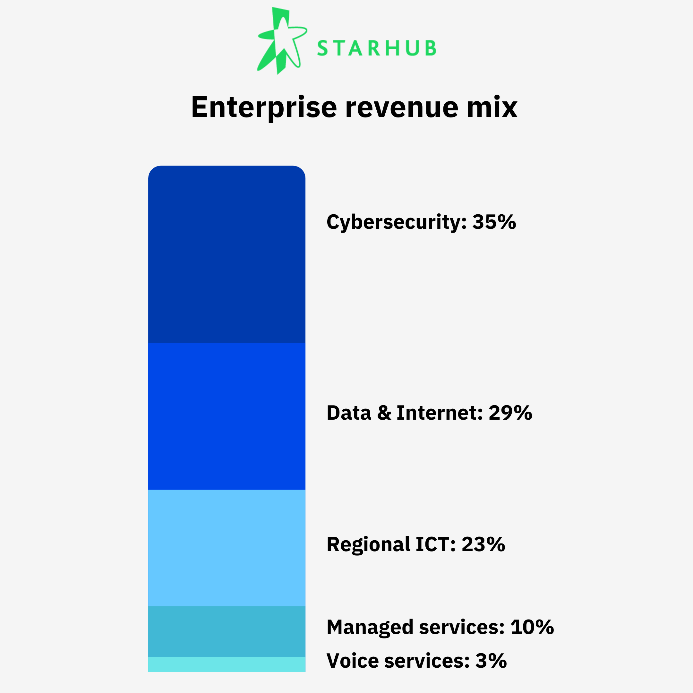
The enterprise business for StarHub accounts for 37.2 percent of its total revenue or US$ 640 million. It registered a YoY growth of 22.6 percent in 2022. The growth can be attributed to the consolidation of JOS SG, JOS MY, and MyRepublic Broadband in the same year. Exhibit 6 highlights the revenue mix for StarHub across its enterprise service portfolio.
Exhibit 6
StarHub enterprise revenue by business segment
#3 Taiwan Mobile continues its strong growth led by e-commerce
Taiwan Mobile has once again stood out with the highest percentage of non-connectivity revenues, reaching 61.2 percent of total. E-commerce services accounted for 59 percent of this revenue and experienced 19 percent growth. Importantly it now accounts for 15 percent of the total earnings. They plan to introduce loyalty programs for momobile bundle users to strengthen customer retention and drive growth. In 2023, they intend to spend US$245 million on expanding momo’s distribution centers.
#4 KT Corp enjoys a diversified base of non-connectivity revenues
KT Corp is an all-rounder when it comes to diversifying to non-connectivity services. It has a diverse set of offerings for both enterprise and consumers spanning cloud, AI, financial services, content, media and entertainment. With 13 percent of its total business coming from content and media business, it is one of the leading players in this segment.
#5 NTT Docomo partners for growth and building on data analytics
NTT Docomo organises its business across three distinct segments:
- enterprise,
- smart life, and
- consumer communication.
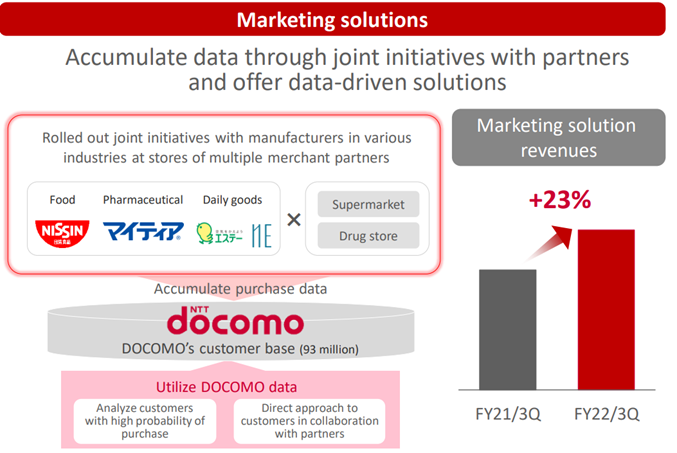
The smart life business is the primary source of non-connectivity revenues for NTT Docomo, with finance and marketing solutions being significant contributors to its growth. In particular, it has adopted a compelling approach within its marketing solutions by forming partnerships with companies from different industries and leveraging data analytics.
Corporate customers can post ads that are driven by data-driven solutions. It has also developed a new initiative that obtains cross-industry purchasing data, which is then utilized to propose new products and initiatives to its manufacturing and retail customers. With the largest customer base in the industry and a broad network of merchant partners, the telco continues to expand its marketing support business for manufacturing and retail customers.
Exhibit 7
Marketing solutions from NTT Docomo
#6 Globe’s emerging non-connectivity segment records the highest growth rate of 58.8 percent
Globe Telecom has made significant strides in its non-connectivity segment over the past few years, which is still in its nascent stages. They have built a strong foundation for future ecosystem-driven growth.
Exhibit 8
Non-connectivity eco-system of Globe
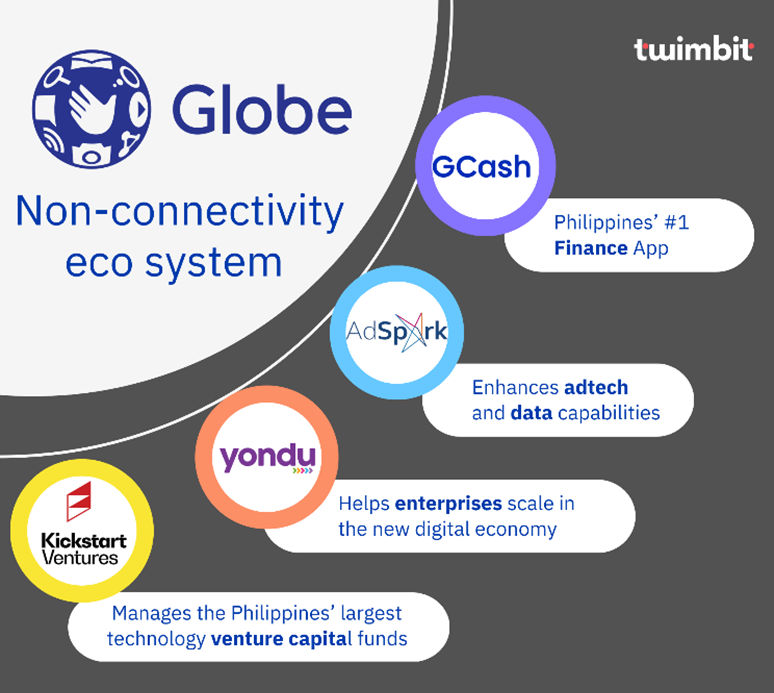
Globe’s success in financial service success is notable, particularly with GCash emerging as the top finance app in the Philippines. GCash boasts 76M registered users, 5.8M merchants and social sellers, and 855 GLife merchant partners.
Besides dominating the e-wallet market, GCash expanded to digital financial services like credit, savings, wealth, and insurance. They have disbursed over ₱57B of loans to 2M unique borrowers through their products, including revolving credit lines, cash loans, and buy-now-pay-later (BNPL), backed by their proprietary credit score.
#7 SoftBank dominates non-connectivity revenues with business across all four pillars of services
SoftBank stands out as the only telco among those we analyzed that has successfully diversified into all non-connectivity categories, making it the most diverse telco in the region. The Japanese operator’s growth strategy, labelled “Beyond Carrier,” aims to expand into various ICT businesses beyond the telecoms carrier framework
This strategy has resulted in 31.3 percent of SoftBank’s total revenues, amounting to US$16 billion, coming from non-connectivity services. Moreover, such revenues are growing at an impressive rate of 8.4 percent.
Exhibit 9
Diversification of SoftBank into non-connectivity streams
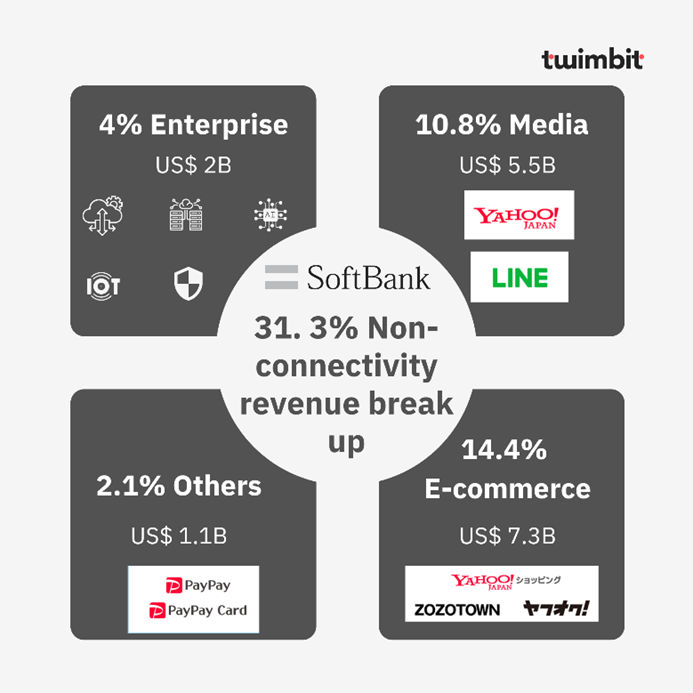
SoftBank has yet to fully capitalize on the enterprise segment, despite its peers in the Japanese market experiencing tremendous contributions from this sector. Media has been a strong part of SoftBank’s business, primarily due to the Line app.
E-commerce has been a catching trend in the industry that only a handful of telcos have been able to effectively leverage. SoftBank is also making progress in this high-growth segment. Softbank is making an ambitious play in the financial services segment and its ecosystem play is illustrated in exhibit 10.
Exhibit 10
Financial services eco-system created by SoftBank

Hope you enjoyed this one
Check out our report: The state of APAC telcos 2023