
Key Takeaways
- APAC Banks generated USD 168.31 billion in net revenues in Q2 2023, representing an increase of 4.74% from the previous USD 160.7 billion in Q2 2022.
- Chinese banks are the most profitable, generating an average of USD 26.28 billion in net revenues.
- Revenue from Chinese banks comprises 62.45% of total net revenues generated in APAC in Q2 2023.
- Average net profits of APAC Banks increased from USD 60.88 billion in Q2 2022 to USD 64.13 billion in Q2 2023, signifying a YoY growth of 5.34%.
- Chinese banks generated 67.5% of the total net profits in APAC.
- SBI recorded its highest net profit ever at USD 2.05 billion driven on the back of high non-interest income.
- Fee income decreased by 2.47% to USD 30.61 billion in Q2 2023.
- China, Malaysia, the Philippines, Singapore and Thailand reported declining fee incomes.
- Indonesia and South Korea reported modest growth of 1.91% and 1.31% respectively.
- Indian Banks reported strong YoY growth of 13.34% in fee income driven by product cross-selling, digital banking services and fintech partnerships.
- The average net interest margin (NIM) in APAC stood at 3.16% in Q2 2023.
- Indonesian Banks have the highest NIMs at 6.30%, followed by Indian Banks at 4.06%.
- Chinese and South Korean Banks have the lowest NIMs at 1.72% and 1.69% respectively. These low NIMs are due to low-interest rates by the central banks and high non-performing loans (NPLs) in the country.
- Non-performing loans have significantly declined in the APAC region at 14.55%. The average NPL for the countries analysed is 1.90%, among the world’s lowest.
- Singapore Banks’ average cost efficiency improved by 10.59% between Q2 2022 and Q2 2023.
- Banks generate record-high revenues with relatively low increases in operating costs.
- The average loan-to-deposit ratio (LDR) is 85.09%, which is within the ideal 80-90% range.
- Apart from the Philippines, all the regions which fall outside the ideal range only deviate by negligible points.
- Banks in the Philippines have an LDR of 72.78%.
- Banks in the Philippines should disburse more loans to increase their profitability.
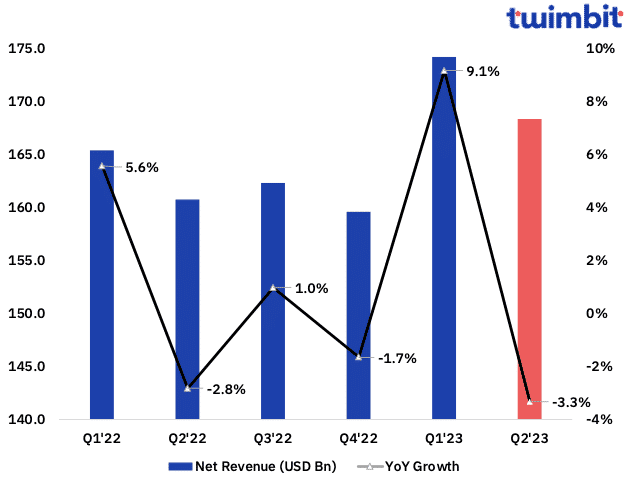
APAC Banks surpass USD 168 billion in net revenues in Q2 2023
In Q2 2023, APAC Banks recorded a net revenue growth of 4.74% YoY with an average net revenue of USD 4 billion. The total net revenue of the 42 banks analysed stood at USD 168.31 billion, up from USD 160.7 billion in Q2 2022.
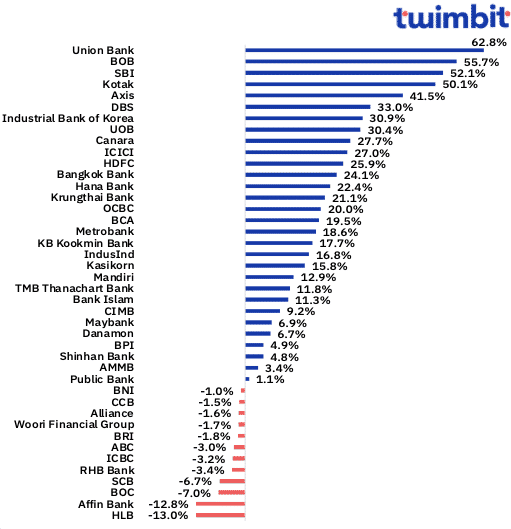
- 23 of 42 banks recorded double-digit growth in net revenues.
- 71% recorded a positive change.
- 29% recorded a negative change.
- Union Bank of the Philippines
- Union Bank recorded the highest net revenue growth at 63% (USD 333 million).
- Non-interest income grew by 146% from USD 43 million in Q2 2022 to USD 107 million in Q2 2023, driven by increased fee income through customer transactions.
- Customer transactions recorded an increase of 211% between Q2 2022 and Q2 2023.
- Fee income grew from USD 31 million in Q2 2022 to USD 91 million in Q2 2023, accounting for 85% of the bank’s total non-interest income.
- Net interest income also grew by 40% from USD 161 million to USD 226 million.
- The bank’s loan book expanded by 42% from USD 6.6 billion to USD 9.4 billion.
- Bank of Baroda
- BOB recorded the second-highest net revenue growth at 55.74% (USD 2.1 billion).
- Interest income increased by 40% to USD 3.2 billion in Q2 2023.
- Non-interest income grew by 181% from USD 144 million in Q2 2022 to USD 404 million in Q2 2023.
- The growth was driven by an 18% fee and treasury income increase from USD 72 million to USD 140 million.
- State Bank of India
- SBI recorded the third-highest net revenue growth at 52% (USD 6.2 billion).
- Net interest income and non-interest income grew by 24.71% and 421.7%, respectively.
- Net interest income was attributed to a 44% loan interest increase.
- Non-interest income was influenced by the sale and revaluation of investments
- The bank recorded a loss of USD 797 million in Q2 2022 and recorded a profit of USD 468 in Q2 2023
- These one-off items resulted in an exponential growth in fee income for the bank
- Excluding the one-off items the bank actually recorded a decline of 7.3% in the period analysed
- Hong Leong Bank
- HLB recorded the highest net revenue decline at 12.95% (USD 293 million).
- The 6% decline in net interest income, partially offset by higher non-interest income, played a pivotal role in HLB’s recent fall.
- Declining interest rates by BNM (Bank Negara Malaysia) have placed increased downward pressure on HLB’s net interest margin.
- Affin Bank
- Affin Bank recorded the second-highest net revenue decline at 12.83% (USD 113 million).
- Net interest income declined by 54.23% to USD 14.68 million in Q2 2023.
- This decline is due to the low-interest rate environment and the bank’s efforts to reduce reliance on high-cost deposits.
- Non-interest income declined from USD 58 million to USD 45 million in Q2 2023.
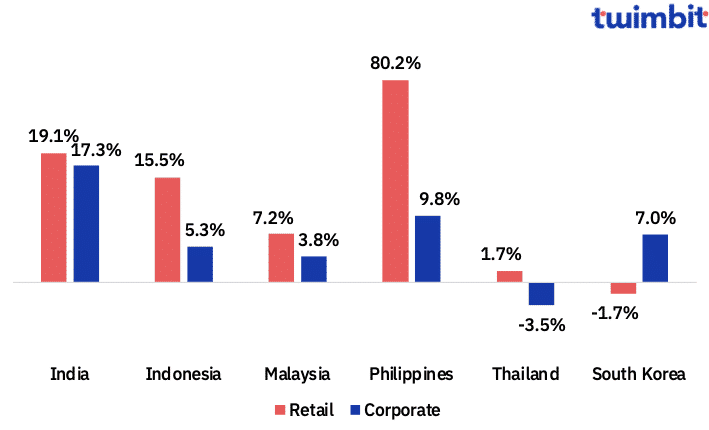
- Philippines
- The retail banking segment increased by 80.2% due to exponential demand for credit cards.
- Union Bank of the Philippines recorded an increase of 867% in its credit card business from USD 163 million in Q2 2022 to USD 1.58 billion in Q2 2023.
- Credit cards account for 48.6% of the overall retail segment of Union Bank.
- Every one in three credit cards in the Philippines is issued by Union Bank.
- India
- The retail and corporate segments increased by 19.1% and 17.3%, respectively.
- Home and vehicle loans represent the majority.
- Increased urbanisation and rising disposable incomes have increased consumer demand for goods and services. This phenomenon consequently led to a more robust market for retail loans (housing and vehicle loans).
- Corporate growth is at 17.3%, the highest among all the countries analysed.
- Increased government spending creates new business opportunities, thereby increasing the demand for corporate loans.
- Thailand
- The corporate segment declined by 3.5% due to the following factors:
- The slowdown of the Thai economy is reducing demand for corporate loans.
- High household debt increases the difficulty of obtaining bank loans.
- The preference to raise funds through bond issuance rather than borrowing from banks is due to regulatory reforms and the availability of low-cost interest rates.
APAC Banks report USD 64 billion in net profits in Q2 2023
In Q2 2023, APAC Banks recorded a YoY increase of 5.54% in their net profits from USD 61 billion in Q2 2022 to USD 64 billion in Q2 2023. The average net profits increased from USD 1.45 billion to USD 1.53 billion.
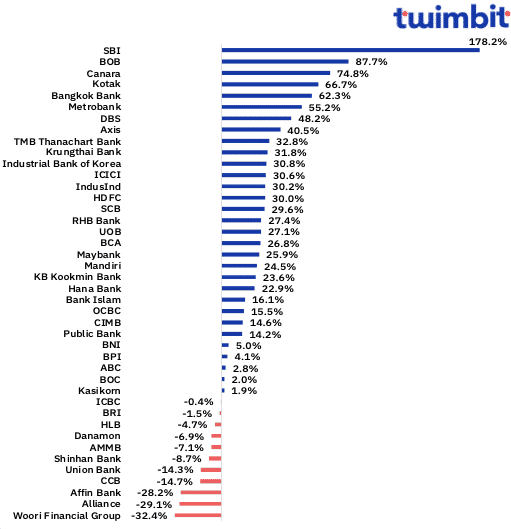
- 31 of 42 banks recorded an increase in net profits.
- 11 of 42 banks recorded a decline in their net profits.
- State Bank of India
- SBI recorded the highest-ever net profit for the fourth quarter in succession.
- The growth in net profit stood at 178.3% from USD 738 million in Q2 2022 to USD 2.05 billion in Q2 2023.
- The primary drivers for this exponential growth are:
- A 74 basis point improvement in the ROA at 1.22%
- A 1,433 basis point improvement in the ROE at 24.42%
- Gross advances grew by 13.9% from USD 353 billion to USD 402 billion
- SME advances grew by 18.27%
- Personal retail advances grew by 16.46%
- Improvement in asset quality with non-performing assets dropping to 2.76% from the previous year’s 3.91%
- Loan loss provision during the quarter was down by 38% to USD 323 million
- The 421.7% increase in non-interest income and the 32% increase in interest income helped SBI generate USD 3.1 billion in operating profits.
- Bank of Baroda
- BOB recorded the second-highest net profit growth at 87.73% (USD 495 million).
- The growth was driven by a 24.4% increase in net interest income from USD 1.07 billion to USD 1.3 billion and an 181% increase in non-interest income.
- Total provisions increased by 15.5% from USD 205 million to USD 237 million.
- Canara Bank
- Canara Bank recorded the third-highest net profit growth at 74.83% (USD 430 million).
- The growth was driven by a 27.71% increase in total income from USD 2.8 billion to USD 3.6 billion.
- Total provisions declined by 11.3% from USD 558 million to USD 495 million.
- Woori Financial Group
- Woori Financial Group recorded the highest net profit decline at 32.35% (USD 515 million).
- Weak economic growth is a driver for the declining net profits in South Korea.
- Loan and financial service demand have also reduced.
- Increasing NPL affects the net profit of Woori Financial Group.
- Non-interest income declined by 30% from USD 309 million in Q2 2022 to USD 216 million in Q2 2023.
- Alliance Bank
- Alliance Bank recorded the second-highest net profit decline at 29.08% (USD 34 million).
- The primary drivers for this decline are the stagnant growth in net interest income and increased operating expenses.
- Net interest income increased by 2.4% from USD 88 million to USD 90 million.
- Operating expenses increased by 9.3% from USD 47 million to USD 52 million.
- Treasury and investment income witnessed an increase in loss of USD 3 million.
APAC Banks record USD 30.61 billion in fee income in Q2 2023
In Q2 2023, APAC Banks recorded a YoY decline of 2.47% in their fee income from USD 31.38 billion in Q2 2022 to USD 30.61 billion in Q2 2023. The average fee income declined from USD 747 million to USD 729 million.
- 26 of 42 banks recorded an increase in fee income.
- 16 of 42 banks recorded a decline in fee income.
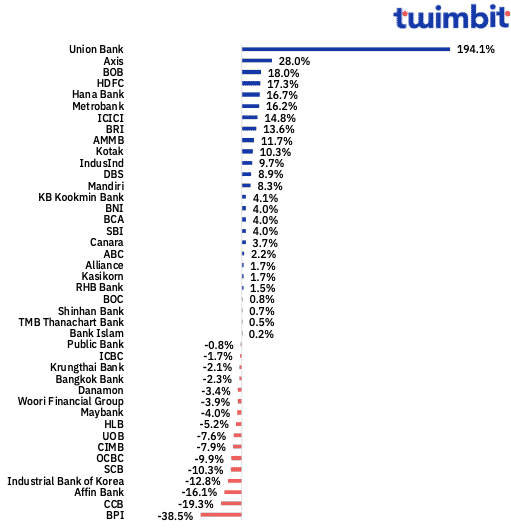
- Union Bank of the Philippines
- Union Bank recorded the highest fee income increase at 194.12% from USD 31 million in Q2 2022 to USD 91 million in Q2 2023.
- The driver for the increase in fee income was customer transactions, which accounted for ~75% or USD 68 million of the income generated.
- Post-COVID-19, the Philippines has experienced rising inflation which has led to higher prices, this is being offset by the use of credit cards that extend the purchasing power of the consumer. This has led to an exponential growth in credit card transactions in the economy.
- The rise in credit card usage is attracting transaction fees which is leading to higher growth of non-interest income among banks, especially for Union Bank.
- Axis Bank
- Axis Bank recorded the second-highest fee income increase at 28% (USD 546 million).
- Retail banking fees accounted for 70% of total fee income and witnessed a 4% point increase from Q2 2022.
- Growth in retail banking fees was driven by the following:
- 53% YoY growth in retail cards and payment fees
- 22% YoY growth in retail assets fees (excluding cards and payments)
- 35% YoY growth in retail liabilities and others
- Bank of Baroda
- BOB recorded the third-highest fee income increase at 18% increase (USD 183 million).
- Growth in fee income was driven by:
- 21.3% growth in commission, exchange, and brokerage fees from USD 75 million to USD 91 million
- 33.2% growth in incidental charges from USD 36 million to USD 47 million
- Bank of the Philippine Islands
- BPI recorded the highest fee income decline at 38.5% (USD 125 million).
- 45% or USD 91 million of the fee income generated by the bank in Q2 2022 was the result of a one-off gain from the sale of an asset.
- Excluding the gain from this sale, the fee income for the bank was USD 112 million in Q2 2022.
- Excluding the one-off gain, the bank recorded an 11.29% increase in fee income.
APAC Banks recorded an average net interest margin of 3.16% in Q2 2023
The average net interest margin (NIM) achieved by the 41 banks analysed in APAC stood at 3.16% in Q2 2023 compared to 3.02% in Q2 2022. 34% of the banks analysed reported a decline in their NIM.
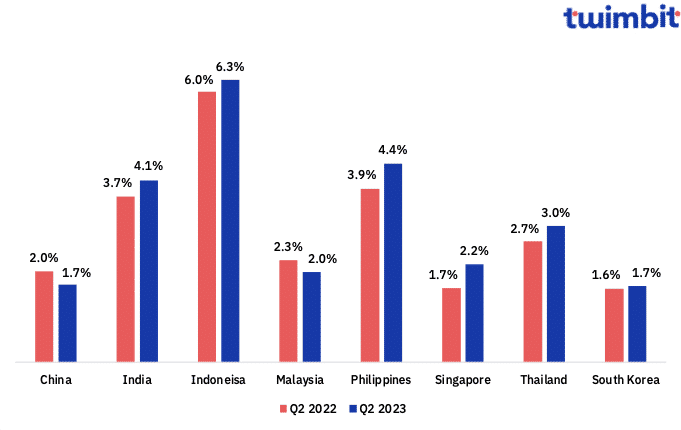
- China
- Chinese banks witnessed the highest NIM decline at 14.69%.
- Some of the drivers of the declining NIMs in China are as follows:
- Lowering interest rates by the central bank to boost economic growth leads to declining interest rates that banks can charge on loans.
- Intense competition has led to a lending spread decline, further shrinking the difference between the interest rates banks charge and pay on loans.
- The slowing Chinese economy is causing a decline in loan demand, increasing downward pressure on NIMs.
- Singapore
- Singapore banks have witnessed the highest increase in their NIMs at 31.85% between Q2 2022 and Q2 2023. The current average NIM stands at 2.2%.
- MAS (The Monetary Authority of Singapore) has been raising interest rates to slow inflation, allowing banks to charge higher interest rates on loans.
- The concentration of the Singapore banking industry gives the big banks a lot of market power, allowing them to charge higher lending rates and negotiate lower deposit rates.
- The growing economy increases loan demand, helping banks further boost their NIMs.
Average NPL for APAC Banks has reduced by 32 bps in Q2 2023
- The average non-performing loans (NPLs) for the 42 banks analysed decreased from 2.22% in Q2 2022 to 1.90% in Q2 2023.
- Only 8 out of 42 banks analysed reported an NPL increase.
- South Korea reported an average increase in NPLs by 15.64% of the eight analysed countries.
- However, NPLs in South Korea are among the lowest in the APAC region and stand at 0.41% in Q2 2023.
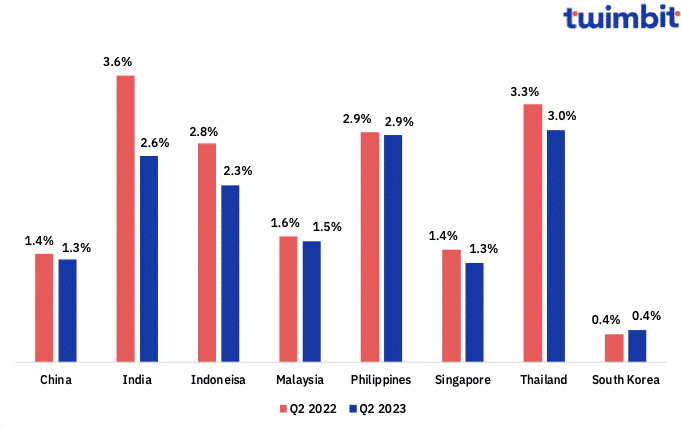
- India
- Indian banks recorded the highest decline in their NPLs at 28% between Q2 2022 and Q2 2023.
- Indian banks have improved their NPL with:
- Early identification and resolution of stressed loans
- Loan restructuring or selling them to asset reconstruction companies.
- Increased provisioning for NPLs reduced its impact on profitability.
- Improved credit appraisal and monitoring to identify potential NPLs early and apply corrective measures.
- Stringent credit checks to assess applicants’ creditworthiness and risk of default.
These initiatives help India avoid disbursing loans to applicants below the acceptable credit risk level.
APAC Banks recorded an average cost efficiency of 42% in Q2 2023
- The average cost efficiency of the 38 banks analysed has decreased by 82 bps from 42.82% in Q2 2022 to 42% in Q2 2023.
- 19 of the 42 banks improved their cost efficiency.
- BOB reduced its cost efficiency from 54.81% to 45.36% in Q2 2023, bringing it below the threshold value of 50%.
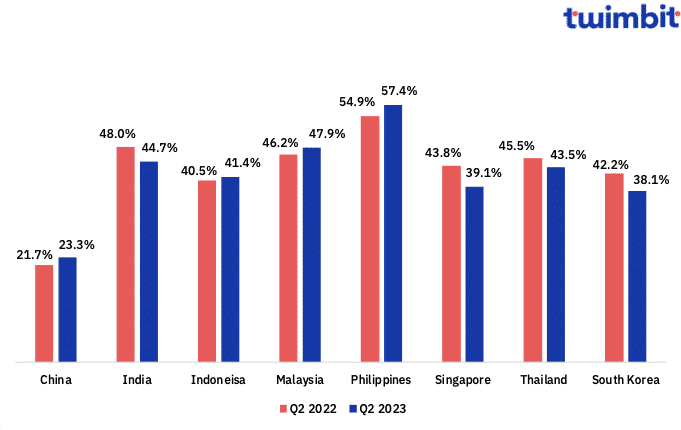
- China
- Chinese banks excel in operational efficiency, boasting an average CE ratio of 23.3% in Q2 2023.
- Their success is attributed to expansive branch networks and substantial customer bases, leading to economies of scale.
- This broad customer reach enables cost distribution across a larger base, reducing unit costs.
- Coupled with rapid technological advancements and government backing, Chinese banks outperform their peers in APAC regions regarding efficiency.
APAC Banks recorded an average loan-to-deposit ratio of 85.09% in Q2 2023
- The average loan-to-deposit ratio (LDR) of the 37 banks analysed has increased by 120 bps from 83.89% in Q2 2022 to 85.09% in Q2 2023.
- Indian, Indonesian and Singapore banks have their LDR within the 80-90% threshold.
- Chinese and Philippine Banks have their LDRs below the threshold, whereas Malaysian and Thai banks have their LDRs above the threshold value.
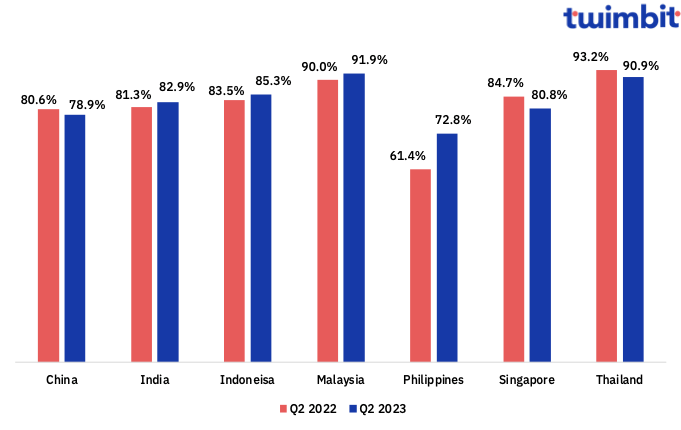
- Philippines
- Banks in the Philippines have the lowest LDRs among the regions analysed, with an average LDR of just 72.8% in Q2 2023. This is way below the ideal threshold value of 80-90%.
- These banks drastically improved their LDRs from 61.4% in Q2 2022 to 72.8%.
- It should be noted that the Bank of the Philippines Islands had an LDR of 80.25% in Q2 2023.
- Some of the reasons for low LDRs in the Philippines:
- Philippine banks must maintain a certain portion of their deposits as reserves at the Bangko Sentral ng Pilipinas (BSP), limiting their lending capacity.
- The stringent lending criteria of BSP minimises the risk of lending to potentially unreliable borrowers, even those with strong credit backgrounds.
- These stringent criteria help banks make better assessments when approving loans.
- The Philippines’ extensive informal economy lacks the conventional financial records and paperwork banks usually demand for loan applications.
- This complicates the assessment of borrowers’ creditworthiness and has deterred banks from extending loans to them.
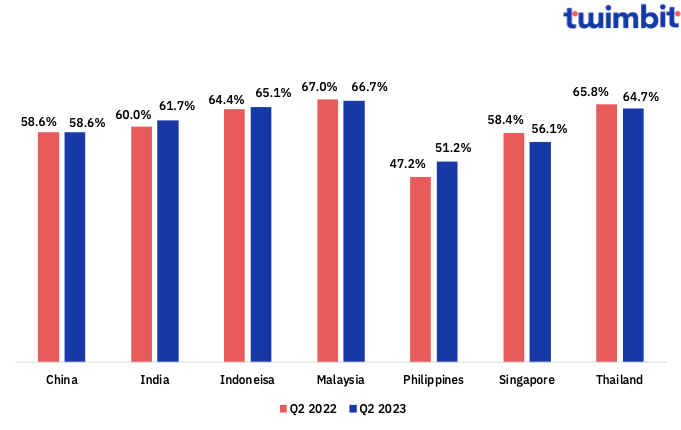
APAC Banks recorded an average loan-to-asset ratio of 62.64% in Q2 2023
The average loan-to-asset ratio of the 37 banks analysed has increased by 46 bps from 62.18% in Q2 2022 to 62.64% in Q2 2023.
Research Methodology and Assumptions
- Data collection has been done based on secondary research about the information provided by the respective banks through their investor presentation and quarterly financial statements. Twimbit follows the calendar year approach for the analysis in this report (meaning Q1 is equivalent to the period of January to March of the year).
- For fair representation and analysis, we have considered a constant currency rate for conversion from local currency to USD value. The USD conversion rate is the average calculated value from January to June 2023.
- The report analyses revenue, net profit and fee income for 42 banks. For net interest margin (NIM) and non-performing loans (NPLs), the analysis is for 41 banks. Additionally, for cost efficiency (CE), loan-to-deposit ratio (LDR) and loan-to-asset ratio, the analysis is for 38, 37 and 37 banks, respectively.
- The revenue figures for all the banks analysed are net of interest and non-interest expenses.
- The fee income figures for South Korean banks are net of fee expenses. Similarly, the figures for Affin Bank, RHB and Public Bank are net of fee expenses. For all other banks, fee income is not adjusted for fee expenses.
- Since not all banks report their LDRs, figures for certain banks are calculated based on the loans and deposits reported in the quarterly financial statements.
- Loan-to-asset ratios are calculated for all the banks using the figures reported in the quarterly investor presentations and financial statements.
To learn more about how Malaysian Banks performed in Q2 2023, click here.
To learn more about how Indonesian Banks performed in Q2 2023, click here.
To learn more about how Indian Banks performed in Q2 2023, click here.
To learn more about how the Filipino Banks performed in Q2 2023, click here.