
Key takeaways
- Net revenues experienced a minor 0.86% increase from USD 171.59 billion in Q2-2023 to USD 173.06 billion in Q2 2024.
- Chinese banks are the most profitable, generating an average of USD 24.59 billion in net revenues.
- Revenue from Chinese banks comprises 56.83% of total net revenues generated in APAC in Q2 2024.
- Total net profits increased by 1.51% YoY, from USD 63.77 billion in Q2 2023 to USD 64.73 billion in Q2 2024.
- Chinese banks generated 62.98% of the total net profits in APAC.
- Industrial and Commercial Bank of China reported the highest net profit at USD 11.59 billion.
- Fee income decreased by 4.81% to USD 22.85 billion in Q2 2024.
- China and Thailand reported declining fee incomes.
- Indonesia reported a modest growth of 2.55%.
- Singapore and Taiwan Banks reported the strongest YoY growth of 18.74% and 18.46% respectively.
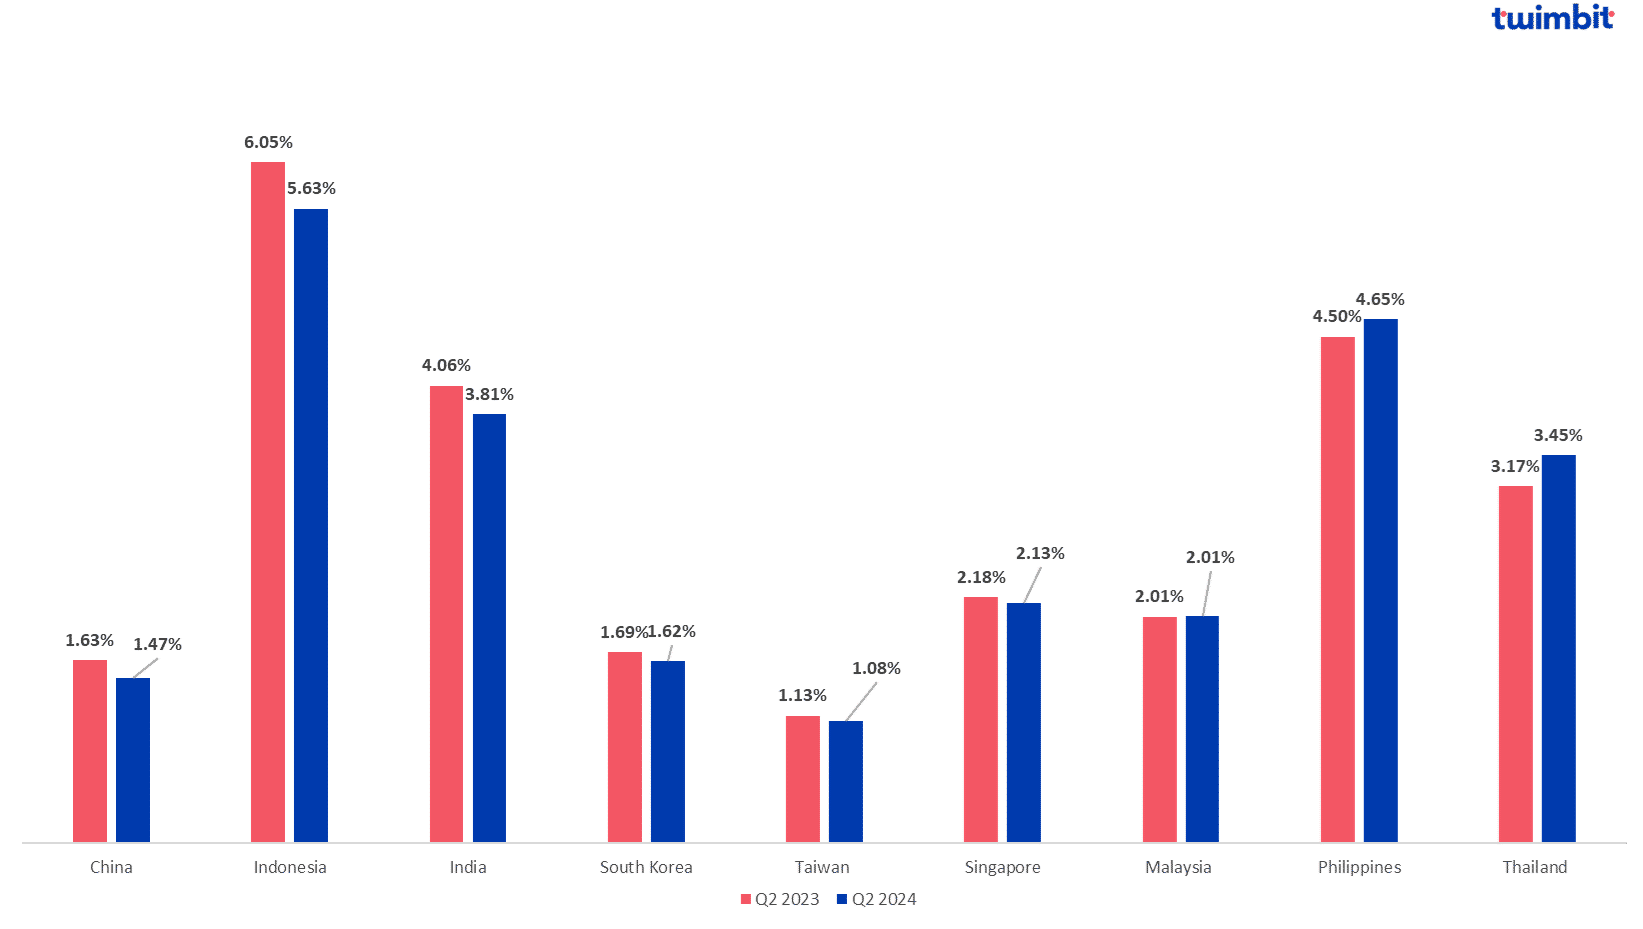
- APAC’s average net interest margin (NIM) stood at 2.87% in Q2 2024.
- Indonesian Banks have the highest NIMs at 5.63%, followed by Philippines Banks at 4.65%.
- Taiwan, Chinese and South Korean Banks have the lowest NIMs at 1.08%, 1.47% and 1.62% respectively. These low NIMs are due to central banks’ low interest rates.
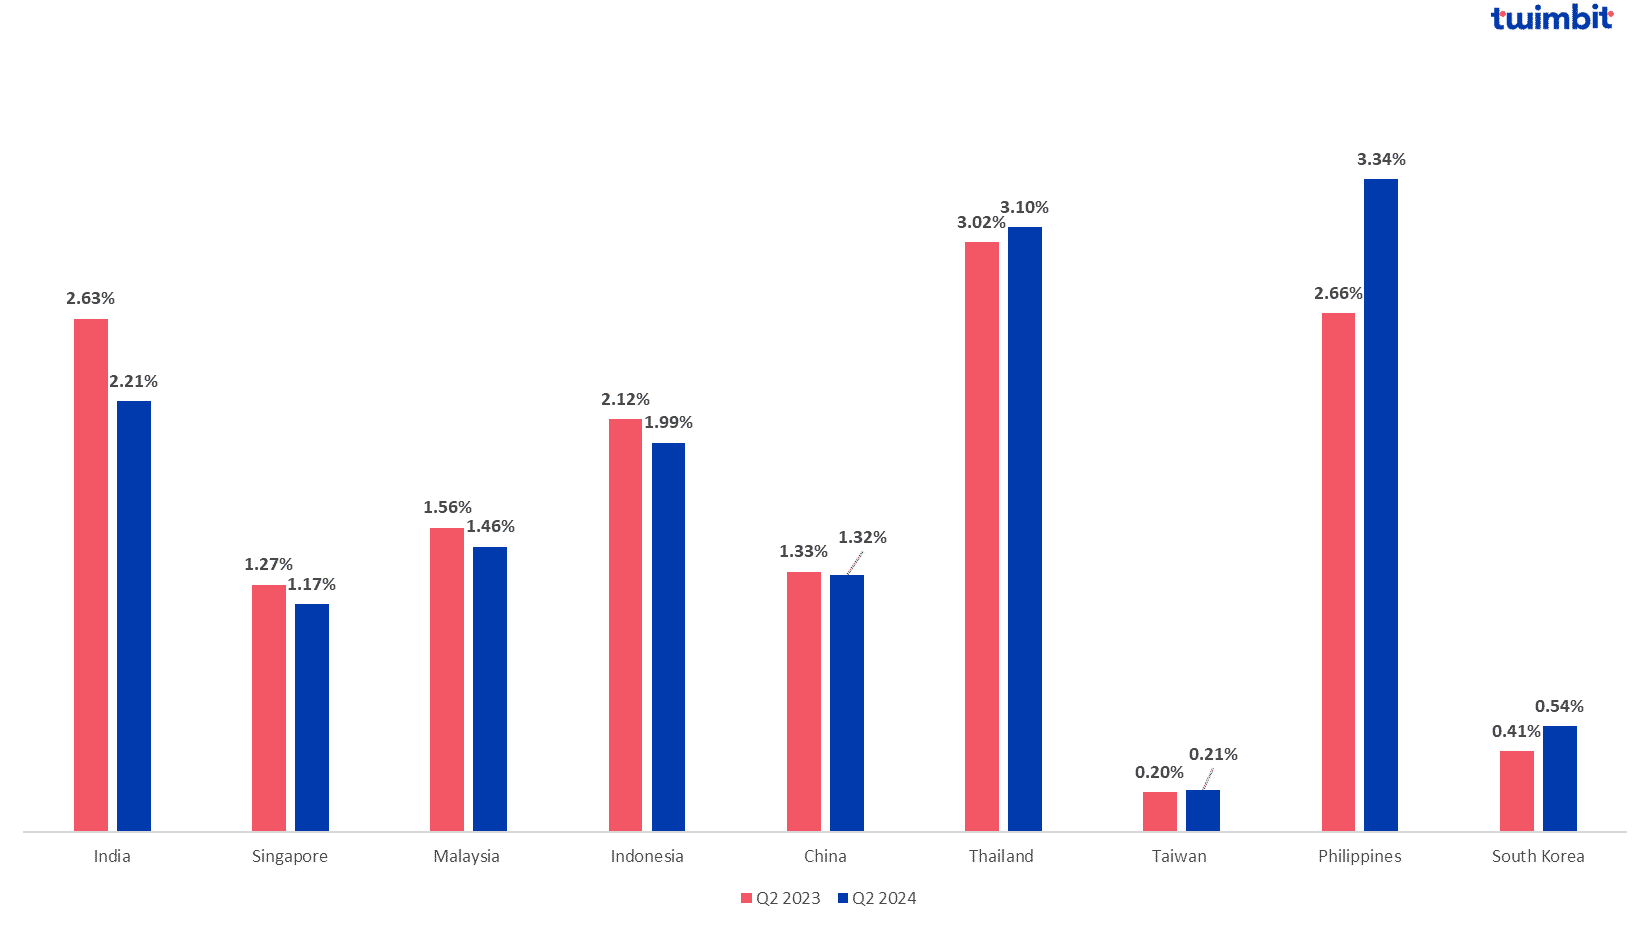
- Non-performing loans (NPL) have increased in the APAC region by 0.94% from 1.69% in Q2-2023 to 1.70% in Q2 2024, among the world’s lowest.
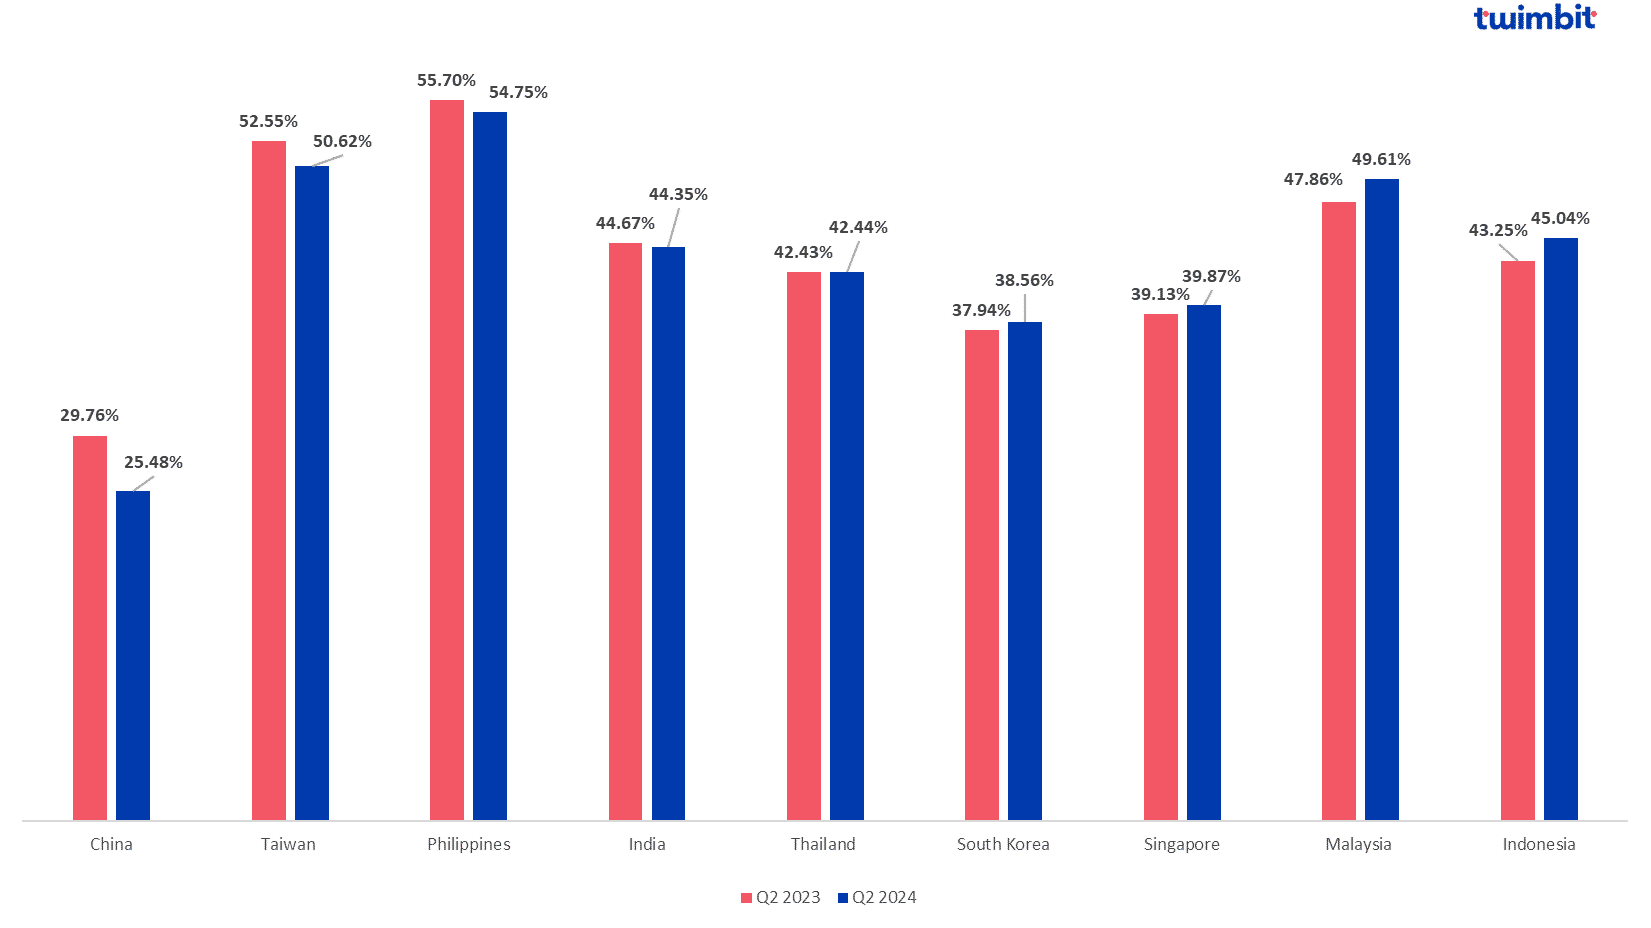
- Chinese Banks’ average cost efficiency decreased by 14.37% between Q2 2023 and Q3 2024.
- Banks generated record-high revenues with relatively low increases in operating costs.
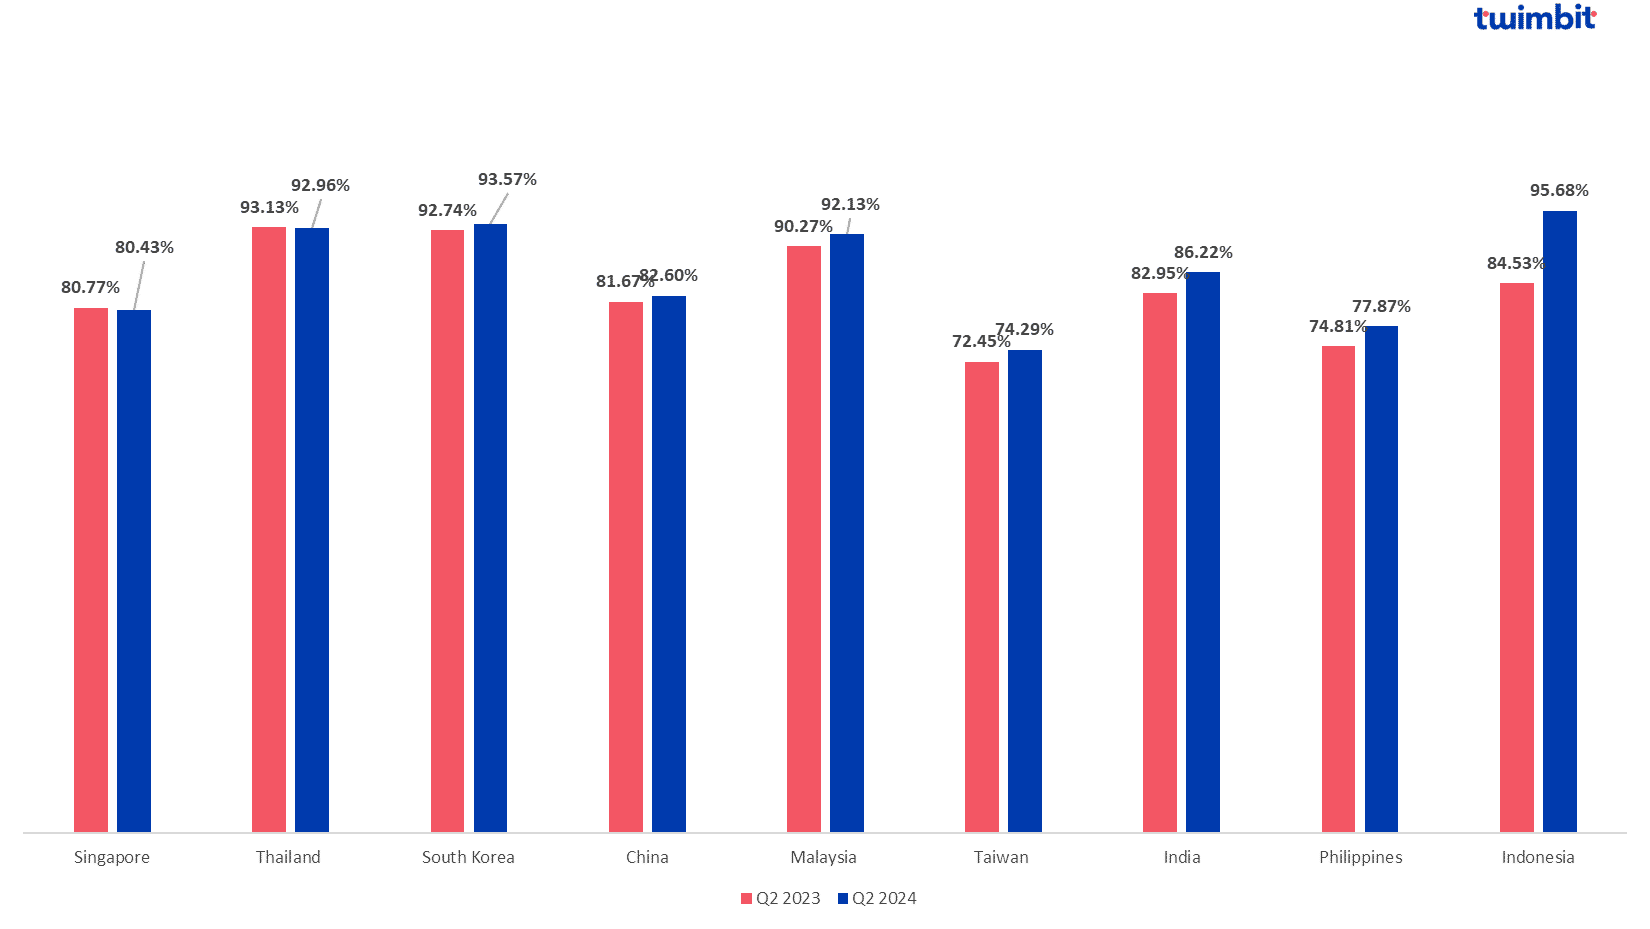
- The average loan-to-deposit ratio (LDR) is 86.19%, within the ideal 80-90% range.
- Singapore, China, and India Banks had an average LDR within the ideal range at 80.43%, 82.60%, and 86.22% respectively.
- Indonesia Banks had the highest LDR at 95.68%, and Taiwan Bank had the lowest LDR at 74.29%.
- Banks in Taiwan should disburse more loans to increase their profitability.
Source: Twimbit analysis, bank financials
APAC banks’ big shift towards digital and AI
APAC banks face complex challenges including regulatory scrutiny, backend inefficiencies, and tightening credit conditions. Despite these headwinds, banks in the region are successfully leveraging technology to digitalize operations, creating new opportunities for growth and resilience.
They now lead with 52% of global digital transactions, reflecting their swift adoption of digital technologies.
The region’s digital economy is projected to grow from USD 53 billion in 2025 to as much as USD 165 billion by 2030. APAC also dominates cross-border remittances, expected to hit USD 269.78 billion by 2026.
APAC leads in digital wallet penetration, with 50% of global spending—USD 7.8 trillion—occurring at point-of-sale. Furthermore, 65% of APAC banking customers prefer digital engagement, highlighting the need for banks to enhance their digital strategies to meet future demands.
The most significant technological shift has been the development of AI processes. Out of the banks analysed, 80% of APAC banks use AI to enhance customer experience, 40% of customer interactions now AI-enabled. Key AI initiatives include:
- AI assistants for financial guidance and automated support (e.g., Axis Bank’s aha and Siam Commercial Bank’s chatbot).
- Hyper-personalisation for tailored recommendations and cross-selling (e.g., OCBC Bank’s AI Oscar and Bank Mandiri’s personalized ads).
- Automated loan approvals with AI-driven customised rates (e.g., Axis Bank and Siam Commercial Bank’s digital loan servicing).
These trends illustrate how APAC banks are leveraging technology to remain resilient and lead in global innovation.
Source: Twimbit analysis, Industry reporting
APAC banks surpassed USD 173 billion in net revenues in Q2 2024
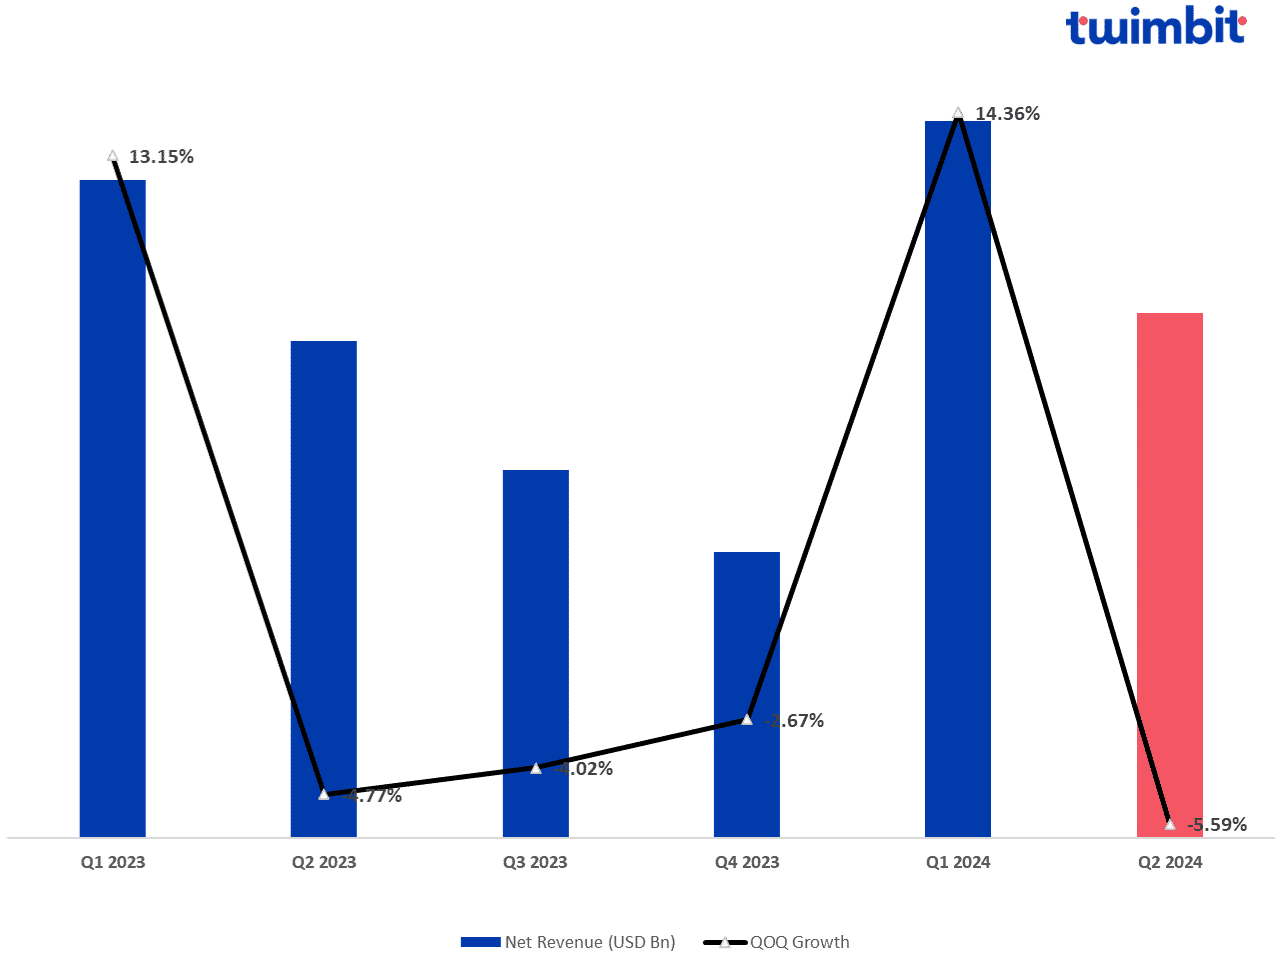
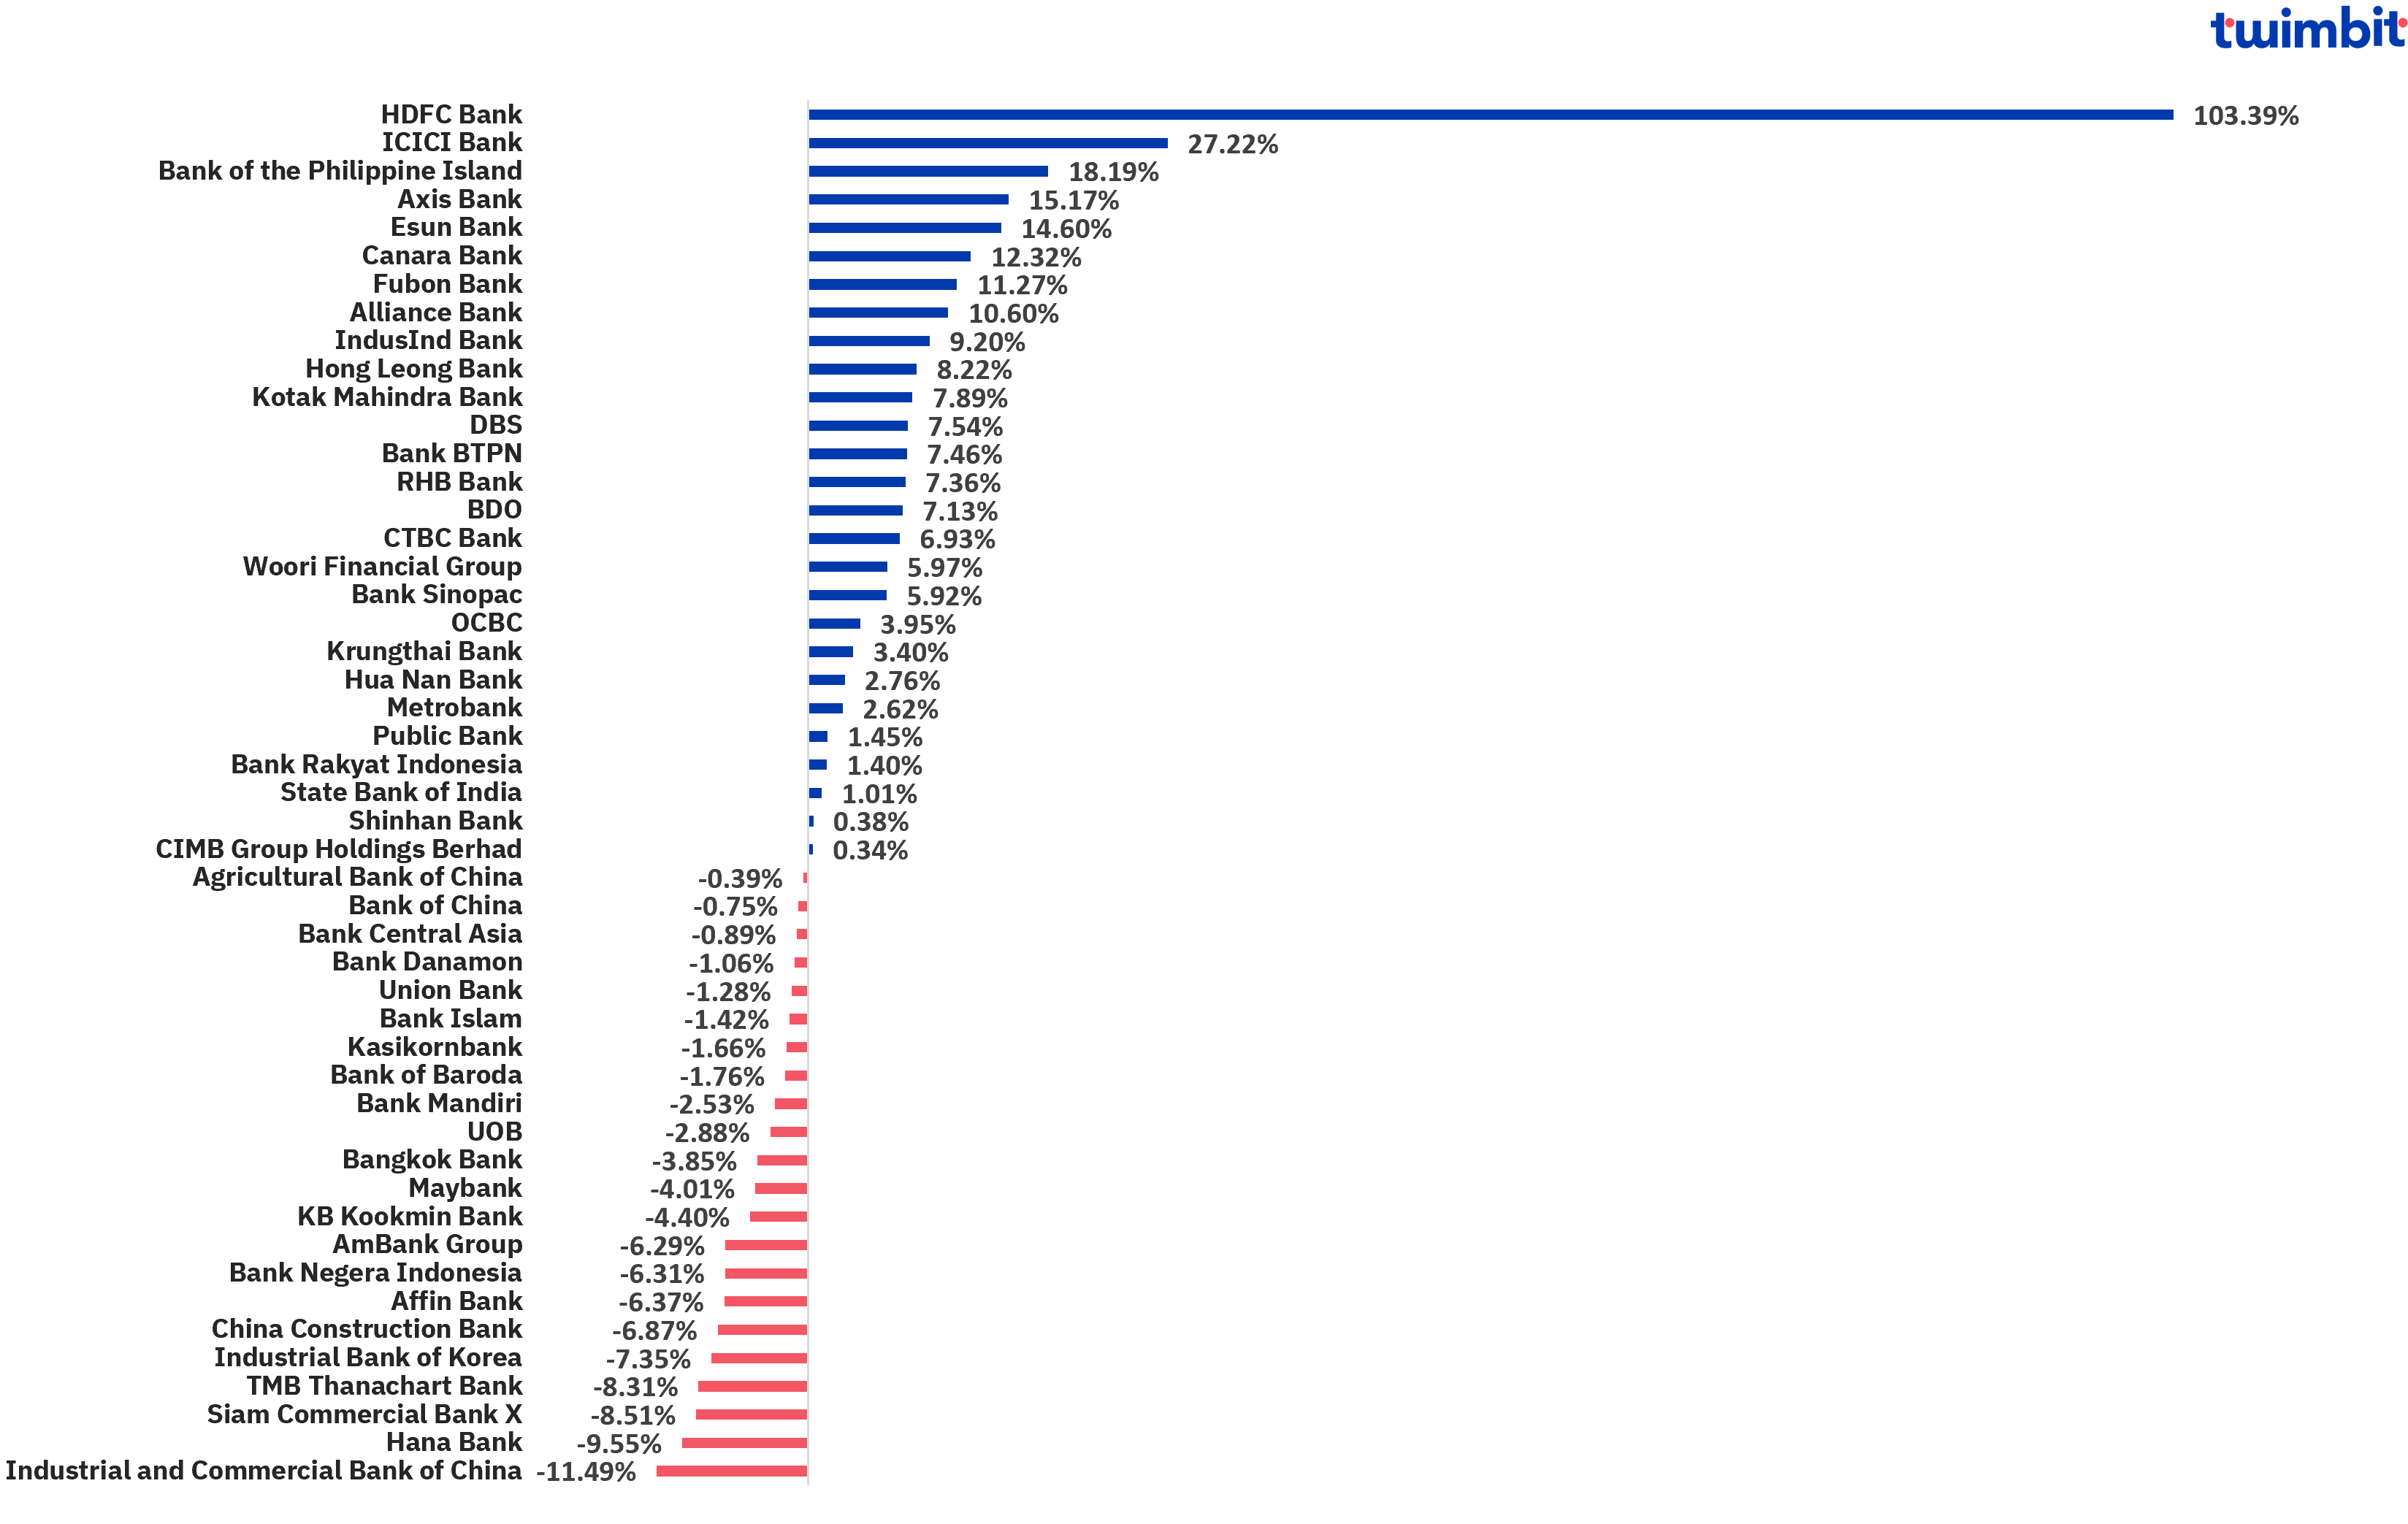
In Q2 2024, APAC Banks recorded a net revenue growth of 0.86% YoY with an average net revenue of USD 3.53 billion. The total net revenue of the 49 banks analysed stood at USD 173.06 billion, up from USD 171.59 billion in Q2 2023.
- 8 of 49 banks recorded double-digit growth in net revenues.
- 55% recorded a positive change.
- 44% recorded a negative change.
Source: Twimbit analysis, bank financials
- HDFC Bank
- HDFC recorded the highest net revenue growth at 103.39% (USD 4.41 billion).
- The merger of HDFC Ltd into HDFC Bank on July 1, 2023, became a primary driver in growing its consolidated net revenues.
- Net interest income grew by 24.5% from USD 2.87 billion in Q2 2023 to USD 3.57 billion in Q2 2024.
- Non-interest income increased by 13.83% from USD 1.12 billion to USD 1.28 billion.
- Fee income grew from USD 765.76 million in Q2 2023 to USD 839.07 million in Q2 2024, accounting for 65% of the bank’s total non-interest income.
- The merger expanded HDFC Bank’s gross loans and advances by 50.23% to USD 99.67 billion in Q2 2024.
- ICICI Bank
- ICICI Bank recorded the second-highest net revenue growth at 27.22% (USD 1.18 billion).
- Net interest income increased by 11.39% from USD 2.52 billion in Q2 2023 to USD 2.81 billion in Q2 2024.
- The increase was mainly driven by a 49.15% growth in non-interest income from USD 1.82 million to USD 2.7 million, attributed to:
- A 20.03% growth in fee income of USD 151.07 million.
- A 73.56% increase in premium income from USD 937.01 million to USD 1.63 billion.
- A 42.30% increase in other income to USD 187.95 million.
- Bank of the Philippine Islands
- BPI recorded the third-highest net revenue growth at 18.19% (USD 110.79 million).
- The increase in net revenue is boosted by a 16.29% increase in net interest income from USD 466.75 million in Q2 2023 to USD 542.80 million in Q2 2024.
- Non-interest income increased by 24.11% from USD 142.63 million to USD 177.02 million, attributed to:
- A 25.4% increase in fee income of USD 31.48 million
- Industrial and Commercial Bank of China
- ICBC recorded the highest net revenue decline at 11.49% (USD 3.45 billion).
- Net interest income decreased by 12.13% from USD 24.07 billion in Q2 2023 to USD 21.15 billion in Q2 2024.
- Non-interest income decreased by 8.89% from USD 5.98 billion to USD 5.45 billion.
- The fee income declined by 17.46% in Q2 2024 to USD 823.17 million.
- Hana Bank
- Hana Bank recorded the second-highest net revenue decline at 9.55% (USD 162.25 million).
- Net interest income decreased by 6.95% from USD 1.5 billion in Q2 2023 to USD 1.39 billion in Q2 2024.
- Disposition/valuation (income from selling assets and securities) decreased by 26.70% from USD 168.03 million to USD 123.16 million.
APAC banks amounted to USD 64.73 billion in net profits in Q2 2024
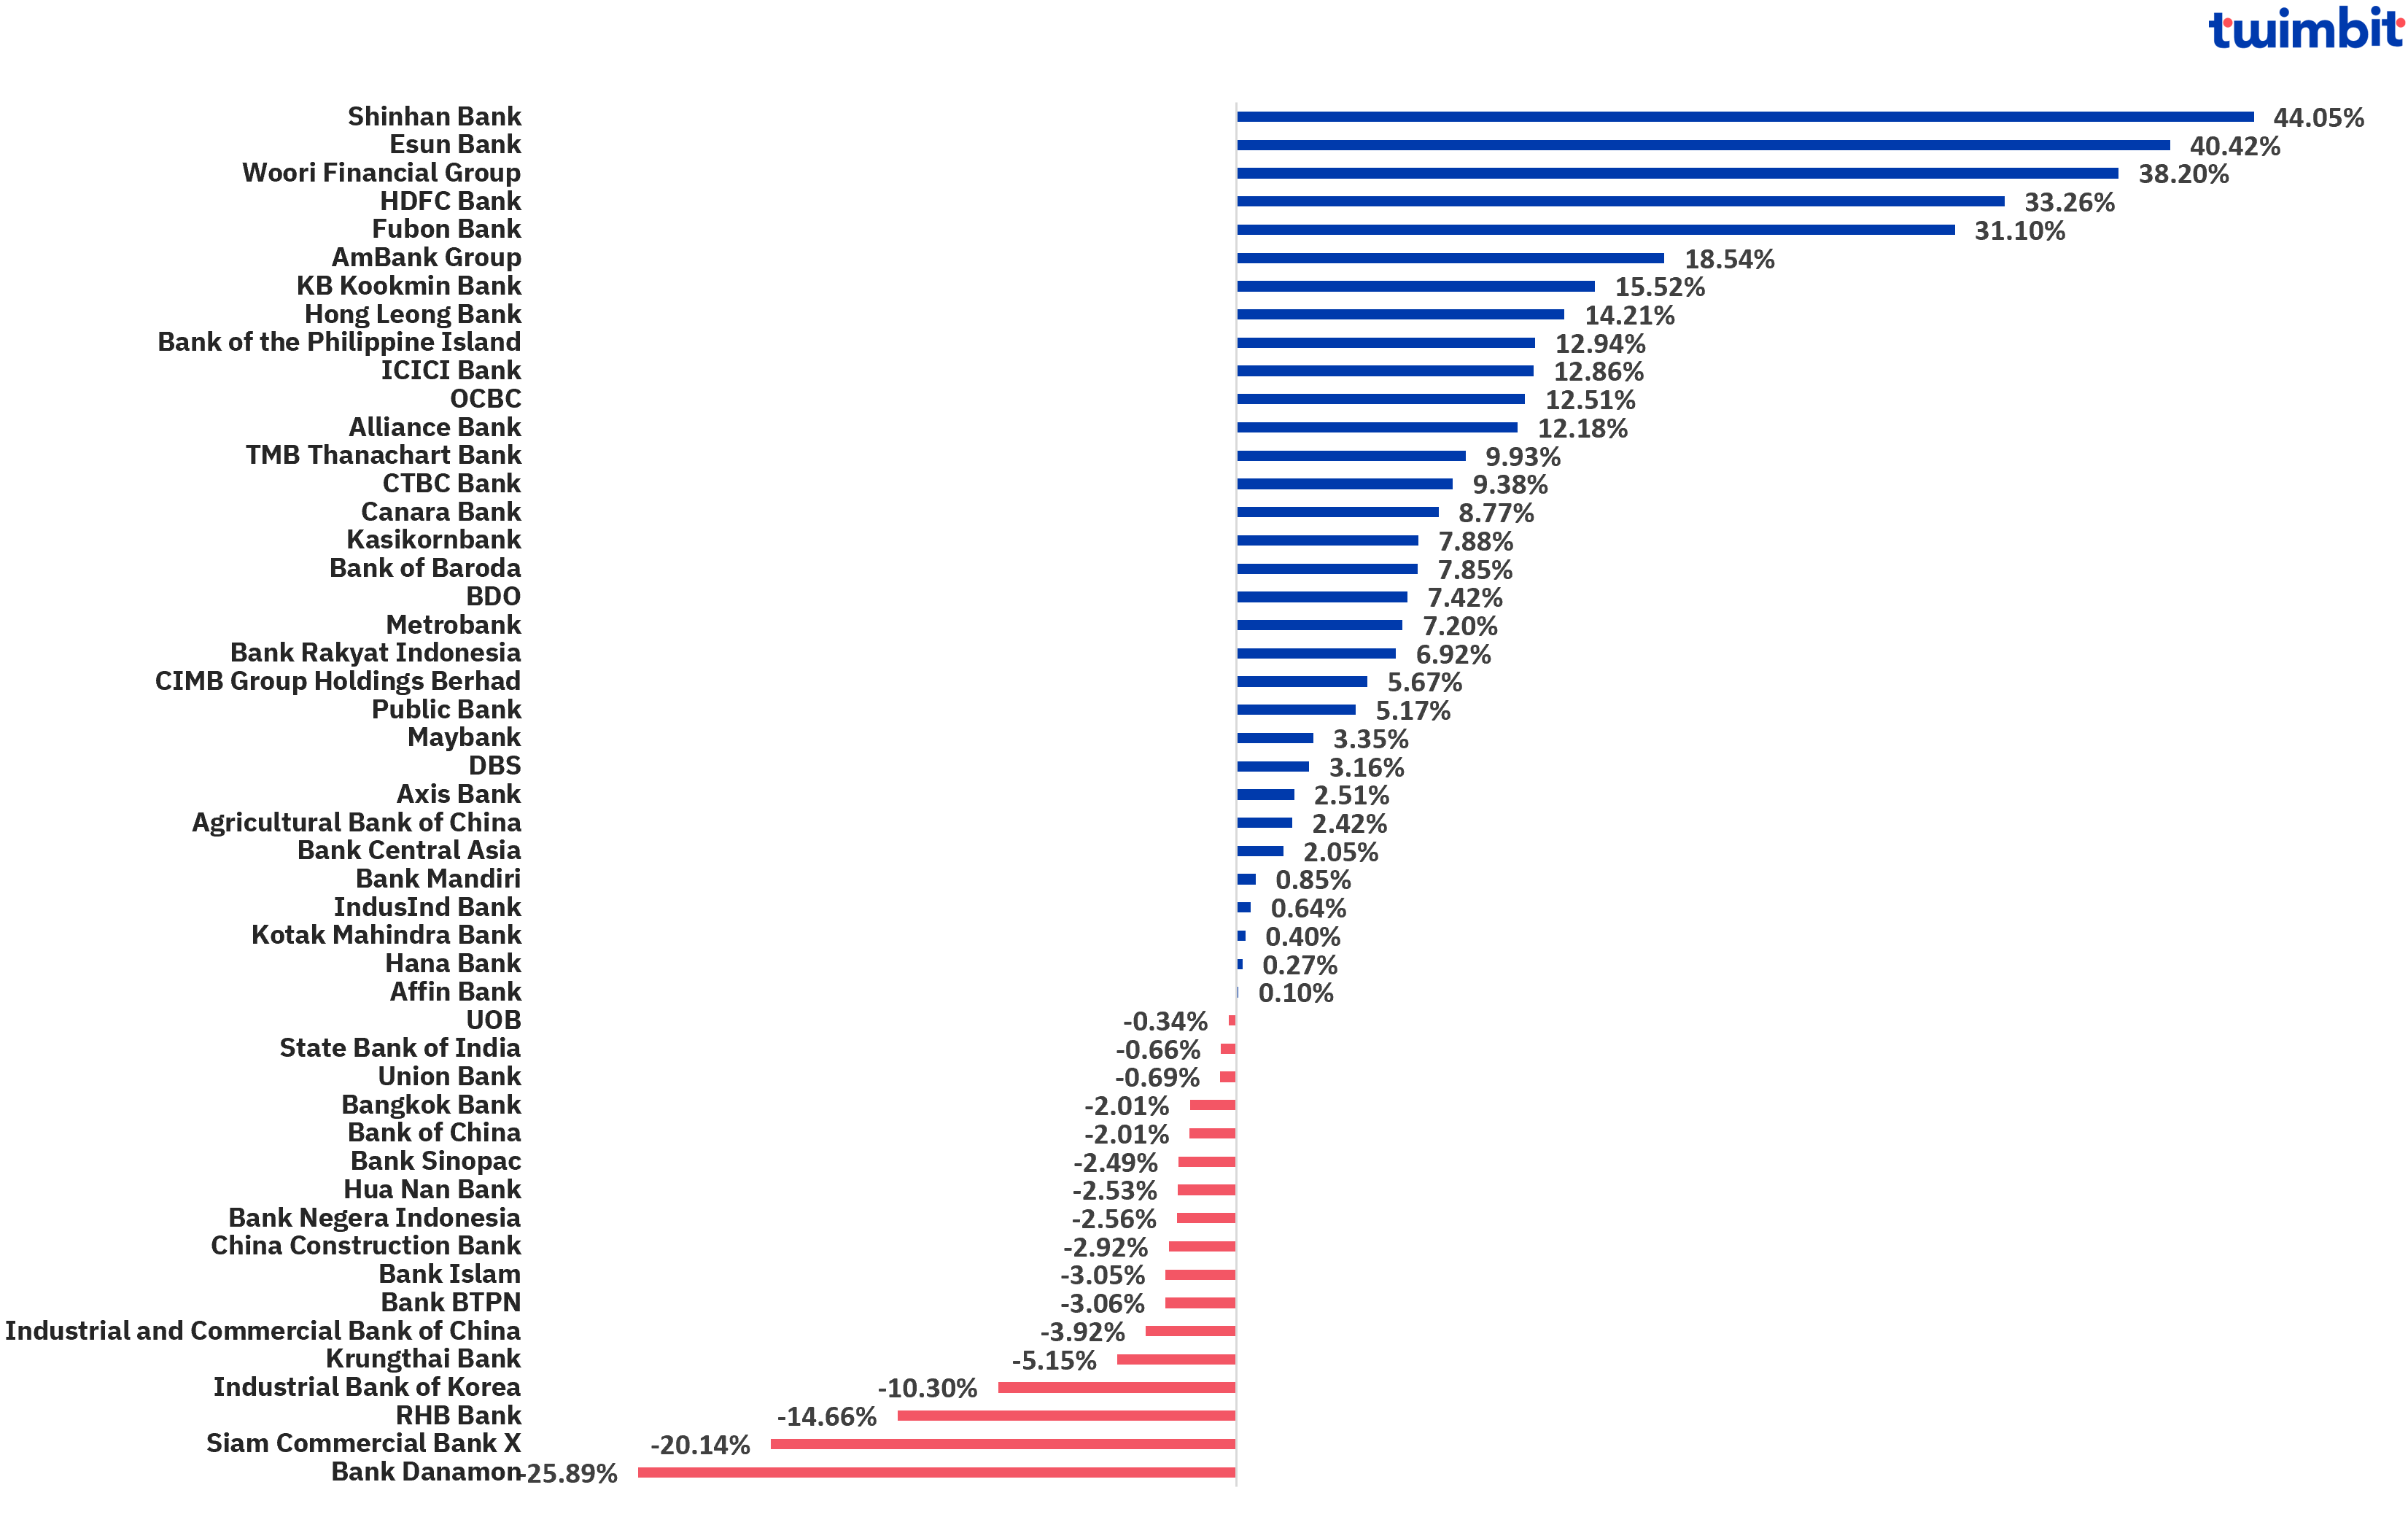
In Q2 2024, APAC Banks recorded a YoY increase of 1.51% in their net profits from USD 63.76 billion in Q2 2023 to USD 64.72 billion in Q2 2024. The average net profits increased from USD 1.30 billion to USD 1.32 billion.
- 32 of 49 banks recorded an increase in net profits.
- 17 of 49 banks recorded a decline in their net profits.
Source: Twimbit analysis, bank financials
- Shinhan Bank
- Shinhan Bank recorded the highest net profit growth at 44.05%, from USD 569.74 million in Q2 2023 to USD 820.69 million in Q2 2024.
- A primary driver for this growth is a 63.36% decrease in provisions for credit losses from USD 216.87 million in Q2 2023 to USD 79.46 million in Q2 2024.
- Non-interest income increased by 11.9% from USD 120.57 million to USD 134.91 million.
- Non-operating income had an exponential increase of 249%, rising from a loss of USD 0.03 million to a profit of USD 0.05 million.
- Esun Bank
- Esun Bank recorded the second-highest net profit growth at 40.42% (USD 52.85 million), setting record high net profit for the bank’s Q2 periods.
- The growth was driven by an increase in operating income attributed to:
- A 7.25% increase in net interest income from USD 237.18 million in Q2 2023 to USD 254.37 million in Q2 2024
- A 23.5% increase in fee income from USD 149.72 million to USD 184.91 million.
- A 18.7% increase in net trading income, derivatives and FX to USD 97.88 million.
- A 60.77% increase in other operating income to USD 2.57 million.
- Woori Financial Group
- Woori Financial Group recorded the third-highest net profit growth at 38.20% (USD 193.81 million).
- The growth was driven by an 83.93% increase in non-interest income from USD 212.3 million in Q2 2023 to USD 390.35 million in Q2 2024.
- Operating income increased by 34.14%, from USD 681.56 million to USD 914.23 million.
- Bank Danamon
- Bank Danamon recorded the highest net profit decline at 25.89% (USD 13.48 million).
- Operating income decreased by 21.21% from USD 61.44 million in Q2 2023 to USD 48.41 million in Q2 2024
- The decline is also due to an increase in costs:
- Cost of credit increased by 13% from USD 66.53 million in Q2 2023 to USD 75.18 million in Q2 2024.
- Operating expenses increased by 0.81% from USD 165.29 million to USD 166.62 million this quarter.
- Siam Commercial Bank X
- Siam Commercial Bank X recorded the second-highest net profit decline at 20.14% (USD 69.75 million).
- The primary drivers for this decline are broad economic weaknesses and one-off expenses from the Robinhood app closure.
- Operating expenses increased by 2.56% from USD 494.28 million in Q2 2023 to USD 506.91 million in Q2 2024.
- Excluding the one-off expenses from Robinhood, operating expenses decreased by 1.86% to USD 485.11 million.
- Fee income decreased by 17.06% from USD 247.40 million to USD 205.19 million.
- Total income decreased due to an 88.28% decrease in investment and trading income of USD 61.6 million.
APAC banks reported USD 22.85 billion in fee income in Q2 2024
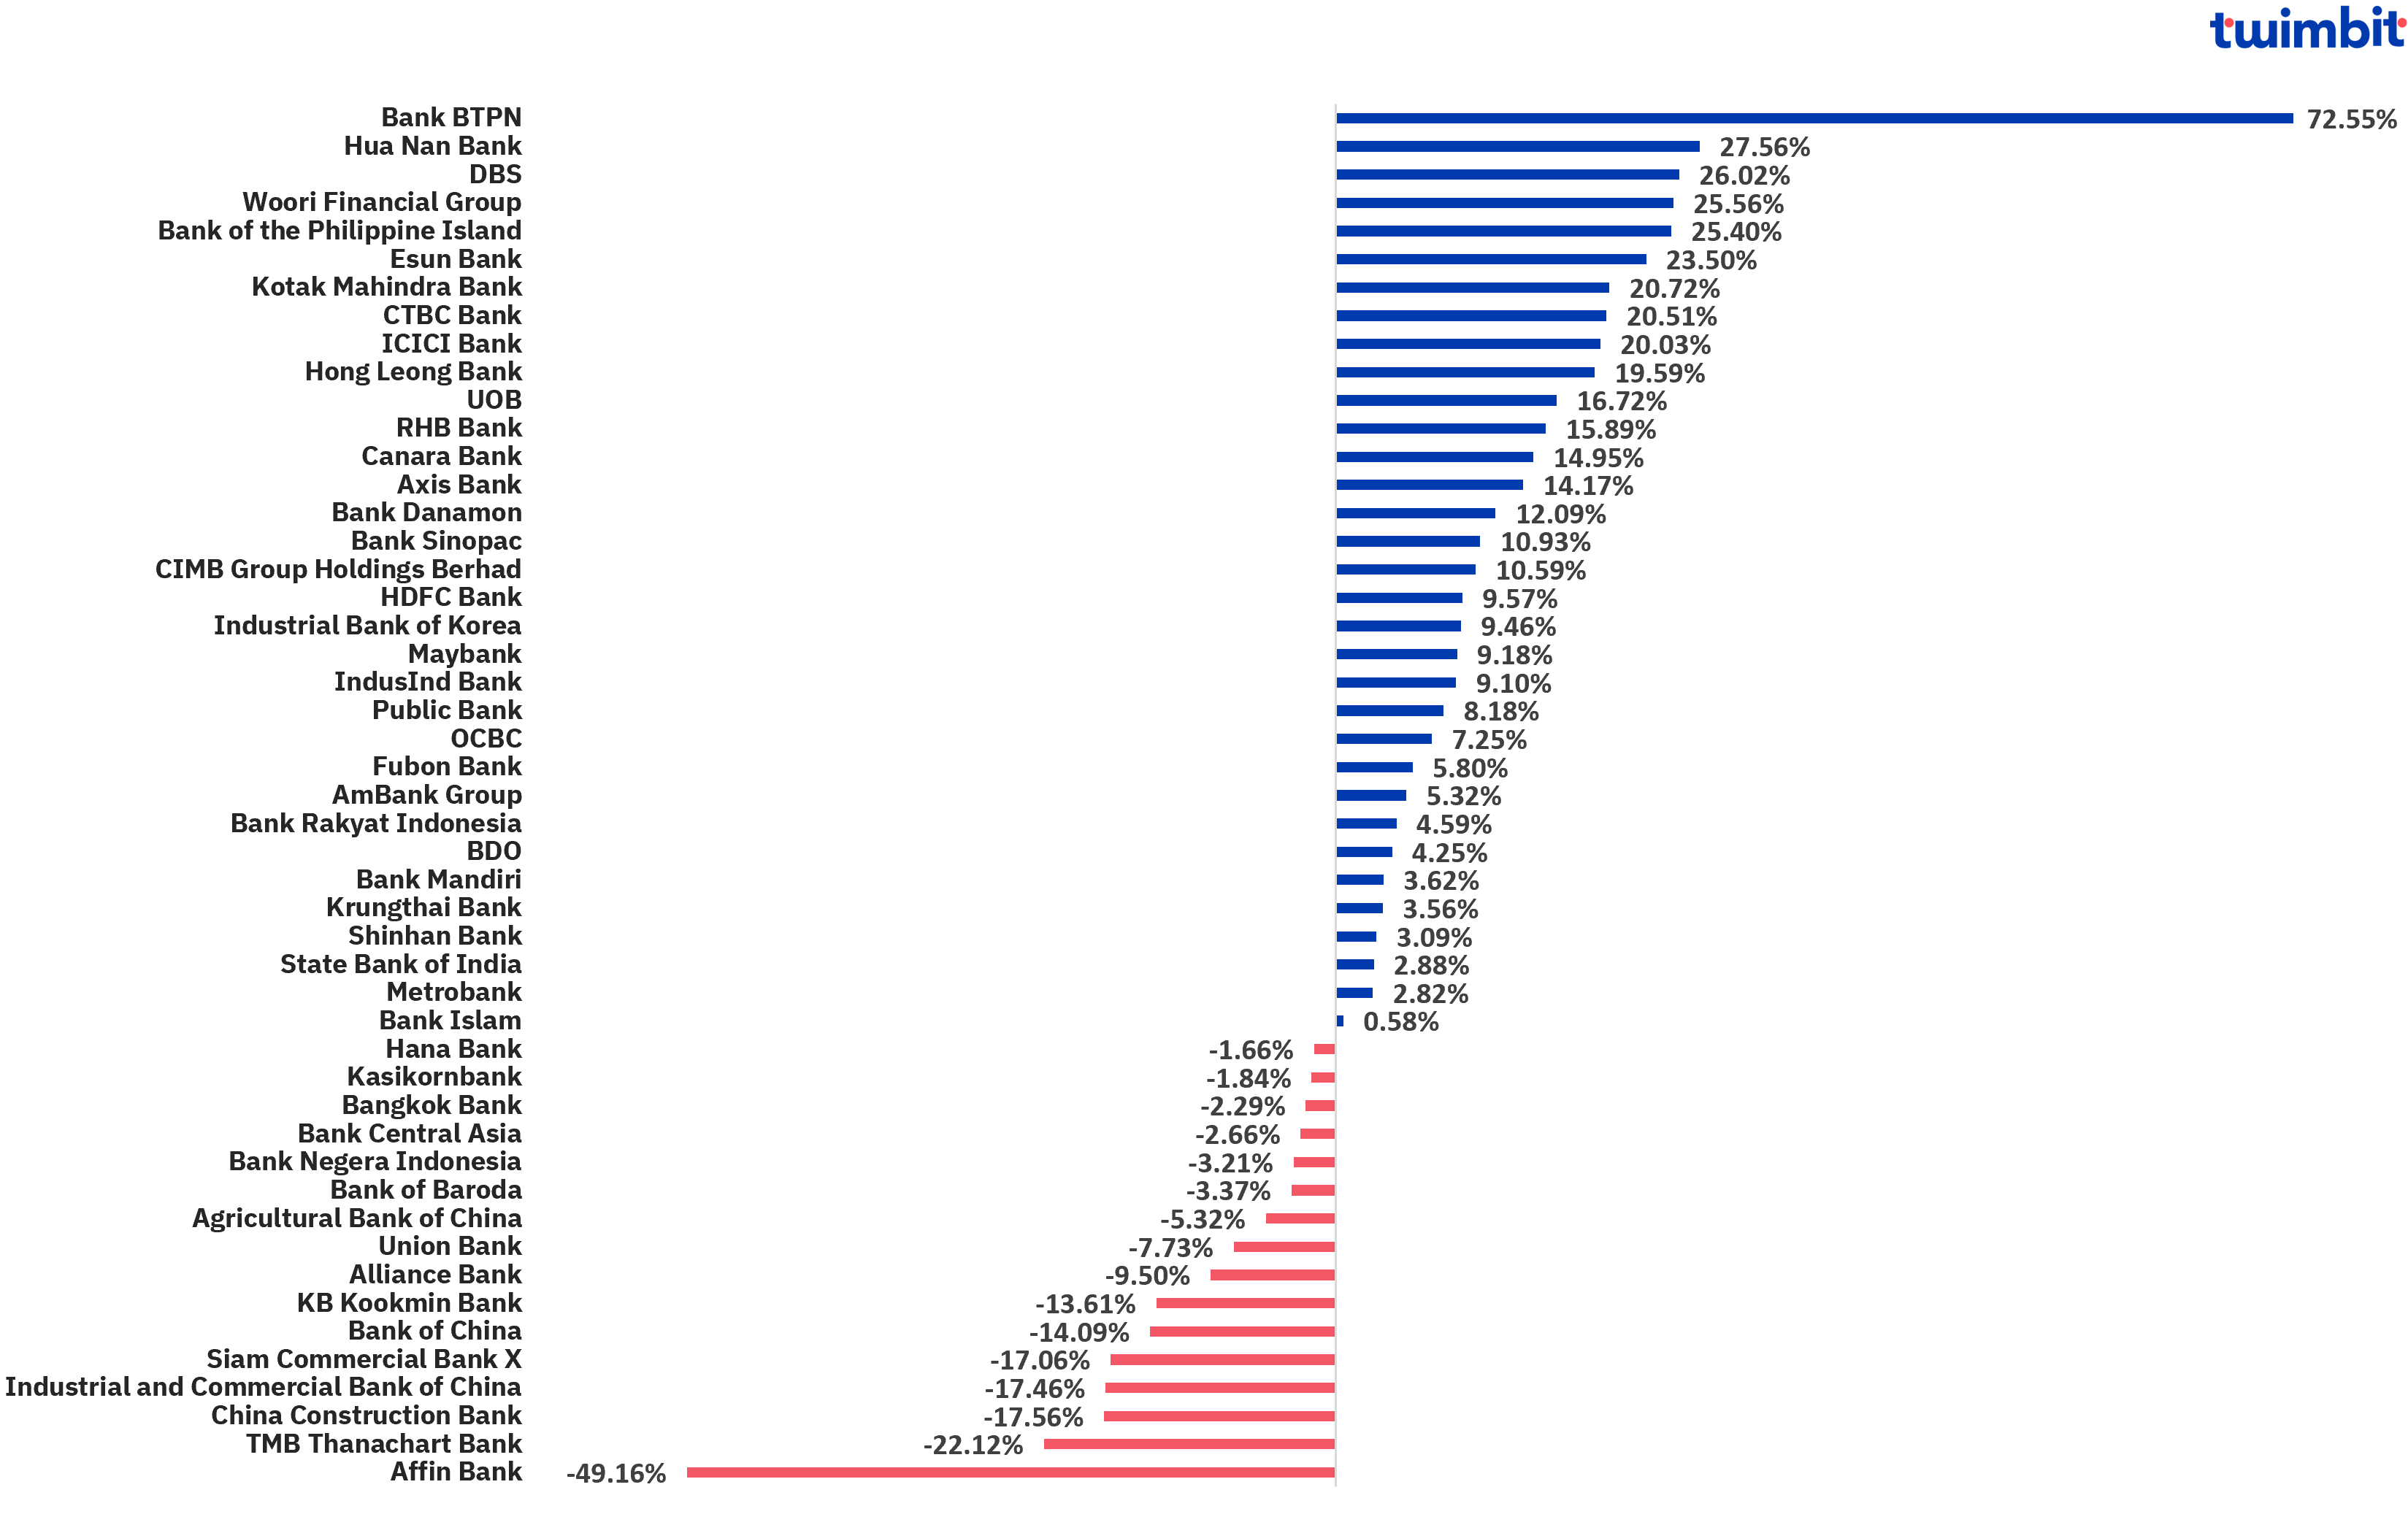
In Q2 2024, APAC Banks recorded a YoY decline of 4.81% in their fee income from USD 24 billion in Q2 2023 to USD 22.85 billion in Q2 2024. The average fee income declined from USD 489.92 million to USD 466.36 million.
- 33 of 49 banks recorded an increase in fee income.
- 16 of 49 banks recorded a decline in fee income.
Source: Twimbit analysis, bank financials
- Bank BTPN
- Bank BTPN recorded the highest fee income increase at 72.55%, from USD 22.03 million in Q2 2023 to USD 38.01 million in Q2 2024.
- The main driver for the increase in fee income was insurance commission income, which increased by 632.41% from USD 0.69 million in Q2 2023 to USD 5.03 million in Q2 2024.
- Loan commission income increased by 13.91% to USD 6.80 million this quarter, accounting for 18% of the fee income generated.
- Other fee income increased by 161.32% from USD 1.63 million in Q2 2023 to USD 4.26 million in Q2 2024.
- Hua Nan Bank
- Hua Nan Bank recorded the second-highest fee income increase at 27.56% (USD 19.24 million), attributed to a strong increase in credit card fee income.
- This increase is due to an increase in:
- Sales with cost rationalisation
- Accumulative fee income base and asset fees
- Banks’ investment banking-related fees
- DBS
- DBS recorded the third-highest fee income increase at 26.02% (USD 159.90 million).
- Growth in fee income was mainly driven by:
- 36% increase in wealth management fees from USD 281.51 million in Q2 2023 to USD 382.78 million in Q2 2024.
- 38.4% increase in loan-related fees to USD 137.45 million.
- 30.7% increase in card fees of USD 54.33 million.
- Affin Bank
- Affin Bank recorded the highest fee income decline at 49.16% (USD 13.04 million).
- Fees and commissions decreased by 30.5% from USD 12.07 million in Q2 2023 to USD 8.39 million in Q2 2024.
- Fee income from wealth decreased by 17.2% to USD 1.37 million in Q2 2024.
APAC banks recorded an average net interest margin of 2.87% in Q2 2024
- The average net interest margin (NIM) by the 49 APAC banks decreased by 2.15% YoY, from 2.93% in Q2 2023 to 2.87% in Q2 2024.
- 69% of the 49 APAC banks reported a decline in their NIM.
- Indonesian banks recorded the highest average NIM at 5.63% in Q2 2024.
- Taiwan banks had the lowest NIM at 1.08%.
- Thailand banks had the highest increase in average NIM from 3.17% in Q2 2023 to 3.45% in Q2 2024.
- China Banks had the greatest decline in NIMs from 1.63% in Q2 2023 to 1.47% in Q2 2024.
Source: Twimbit analysis, bank financials
- Thailand
- Thailand banks have witnessed the highest increase in their NIMs at 8.71% between Q2 2023 and Q2 2024. The current average NIM stands at 3.45%.
- The growing economy increases loan demand, helping banks further boost their NIMs.
- The interest rate environment in Thailand supports higher NIMs. Banks have benefited from favourable interest rate spreads between lending and deposit rates, allowing them to earn more on their loans relative to what they pay on deposits.
- Banks in Thailand effectively optimised their loan portfolios, focusing on high-yield segments such as personal and SME enterprise loans. This strategic allocation has helped generate higher interest income.
- China
- Chinese banks witnessed the highest NIM decline at 9.85%.
- Some of the drivers of the declining NIMs in China are as follows:
- Lower interest rates by the Central Bank to boost the economy have led to banks’ declining interest rates on loans.
- Lower asset yield due to asymmetric interest rate reduction and rising foreign currency interest rates.
- Banking competition has led to a lending spread decline, further shrinking the difference between the interest rates banks charge and pay on loans.
- Lower interest rates by the Central Bank to boost the economy have led to banks’ declining interest rates on loans.
Average NPL for APAC banks reduced by 1 bps in Q2 2024
- The average non-performing loans (NPLs) for the 49 banks decreased from 1.69% in Q2 2023 to 1.70% in Q2 2024.
- 21 out of 49 banks reported an NPL increase.
- Indian banks recorded the highest decline in average NPLs among the APAC banks.
- South Korea reported the highest average increase in NPLs by 30.92% of the 9 countries, from 0.41% in Q2 2023 to 0.54% in Q2 2024.
- Philippines has the highest average NPL for APAC banks in Q2 2024.
- NPLs in Taiwan are the lowest in the APAC region.
Source: Twimbit analysis, bank financials
- Taiwan
- Taiwan banks have the lowest average NPL At 0.21% in Q2 2024.
- Fubon Bank has the lowest NPL among the APAC banks at 0.11%.
- The success of Taiwan banks is attributed to their stable economy and asset quality, in addition to:
- Government support to aid in claiming payments.
- Strict lending policies and FSC lending approvals create a conservative environment.
- India
- Indian banks recorded the highest decline in their NPLs at 15.98% between Q2 2023 and Q2 2024.
- Indian banks have improved their NPL with:
- Strong verification systems, from early identifications to stringent credit checks.
- Improved asset qualities and seasonal increases in credit costs.
- The Philippines
- The Philippine banks recorded the highest average NPL at 3.34% between Q2 2023 and Q2 2024.
- Union Bank had the highest NPL of 7.40% in Q2 2024.
- Higher interest rates have increased NPLs:
- The cost of borrowing increases, causing difficulties in loan repayment.
- Reduces loan demand, leading to banks competing over new loans and lowering credit standards
- Higher monthly payments strain low-income households, making them more likely to default.
APAC banks had an average cost efficiency of 43.41% in Q2 2024
- The average cost efficiency of the 48 banks has decreased by 0.66% YoY from 43.70% in Q2 2023 to 43.41% in Q2 2024.
- 25 of the 48 banks improved their cost efficiency.
- 3 of the 48 banks reported cost efficiency above the ideal range of 40% to 60%.
- Chinese banks had the lowest CE among the APAC banks.
- Filippino banks had the highest CE for this quarter.
- Kotak Bank reduced its cost efficiency by 23.35% from 44.49% to 34.10% in Q2 2024, bringing it below this quarter’s threshold value of 43.4%.
Source: Twimbit analysis, bank financials
- China
- Chinese banks continue to excel in operational efficiency, boasting an average CE ratio of 25.48% in Q2 2024.
- Their success is attributed to the continued advancements and government backing, allowing Chinese banks to outperform other APAC regions efficiently.
- The average operating expenses for the Chinese banks decreased by 2.41% from USD 7.74 billion in Q2 2023 to USD 7.55 billion in Q2 2024.
- A competitive banking sector leads to improved innovation, cost reductions, and efficient services.
- The Philippines
- Filippino banks have the highest cost efficiency (CE), with an average CE of 54.75%, within the ideal 40% to 60% range.
- Driven by integration challenges, Filippino banks display higher integration costs to advance their legacy systems.
- Union Bank had the highest CE decrease among Filippino banks at 9.38%, from 64% in Q2 2023 to 58% in Q2 2024.
- Integration and one-off costs witnessed notable decreases.
- Operational expenses for the bank stabilised at USD 181.65 million.
- Cost efficiency is expected to improve for Union Bank due to an exit from the Treasury Single Account, a unified government structure to optimise and consolidate the use of cash resources.
- BDO had the highest increase in CE among the Philippine banks at 2.89%, from 58.90% in Q2 2023 to 60.60% in Q2 2024.
- Operating expenses increased by 10.60% this quarter to USD 751.97 million, increasing by USD 73.09 million from Q2 2023.
APAC banks recorded an average loan-to-deposit ratio of 86.19% in Q2 2023
- The average LDR ratio of the 49 banks analysed has increased by 298 bps from 83.70% in Q2 2023 to 86.19% in Q2 2024.
- Singapore, Chinese and Indian banks have their LDR within the 80-90% threshold.
- Taiwan and Philippine Banks have their LDRs below the threshold.
- Malaysian, Thai, South Korean and Indonesian banks have their LDRs above the threshold value.
- Taiwan banks have the lowest average LDR among the APAC banks.
- Indonesian banks have the highest average LDR at 95.68%.
Source: Twimbit analysis, bank financials
- India
- Among the APAC banks within the ideal range, Indian Banks had the highest average LDR at 86.22% as of Q2 2024, which increased by 3.95% from Q2 2023.
- The increase is driven by India’s continued economic growth and increasing credit and loan demands.
- Loans increased despite an increase in the cost of funds.
- Maintained deposits, leading to the region staying within the ideal range.
- Asset value and quality continue to improve.
- Taiwan
- Recorded the lowest LDR at 74.29% in Q2 2024, below the ideal threshold value of 80-90%.
- These banks improved their average LDRs by 2.54% from 72.45% in Q2 2023.
- Fubon Bank is the only bank out of the Taiwan banks analysed to have an LDR within the ideal threshold range for Q2 2024.
- The ideal LDR is credited to Fubon Bank’s improvement in the loan mix.
- Taiwan Banks increased loan rates due to a spike in the New Taiwan Dollar.
- Indonesia
- Indonesian Banks have the highest LDRs among the regions analysed, with an increase of 13.19% in their average LDR from Q2 2023 to Q2 2024
- Bank BTPN increased its LDR by 56.8% from an LDR of 83.8% in Q2 2023 to 131.4% in Q2 2024, far outside the ideal range.
- The increase is attributed to a 22% increase in assets and a 19% increase in credit disbursement from Q2 2023 to Q2 2024.
Research methodology and assumptions
- Data collection has been done based on secondary research about the information provided by the respective banks through their investor presentation and quarterly financial statements. Twimbit follows the calendar year approach for the analysis in this report (meaning Q1 is equivalent to the period of January to March of the year).
- For fair representation and analysis, we have considered a constant currency rate for conversion from local currency to USD value. The USD conversion rate is the average calculated value from January to June 2024.
- The report analyses revenue, net profit and fee income for 49 banks. For net interest margin (NIM), loan-to-deposit ratio (LDR) and non-performing loans (NPLs), the analysis is for 49 banks. Additionally, for cost efficiency (CE), the analysis is for 48 banks.
- The revenue figures for all the banks analysed are net of interest and non-interest expenses.
- The fee income figures for South Korean banks are net of fee expenses. Similarly, the figures for Affin Bank, RHB and Public Bank are net of fee expenses. For all other banks, fee income is not adjusted for fee expenses.
- Since not all banks report their LDRs, figures for certain banks are calculated based on the loans and deposits reported in the quarterly financial statements.
To learn more about the banking industry in APAC, read our APAC Banking Titans 2024 report on the platform.