
Key Takeaways
- Average YoY (Year-on-Year) revenue growth slowed from 3.9% in Q1-2023 to 2.5% in Q1-2024.
- Aggregate revenue increased by USD 3.8 billion to USD 324.7 billion in Q1-2024, with 2 of 29 telcos exhibiting double-digit revenue growth.
- Cost-containment measures and operational streamlining efforts resulted in positive EBITDA change for nearly 79% of the analysed telcos.
- Telcos maintained EBITDA margin stability of 35% due to cost-containment measures, operational efficiency initiatives, and continued top-line growth.
- The maturation of 4G and 5G networks in major markets led to a CAPEX decline for around ~62% of the 21 analysed telcos in Q1-2024.
- Overall CAPEX for Verizon, AT&T, T-Mobile, Deutsche Telekom, Bharti Airtel Group, NTT Docomo, and Softbank declined by ~USD 2.9 billion YoY in Q1-2024.
- The average ARPU increased by 2.1% YoY to USD 28 in Q1-2024, led by Verizon and Millicom.
- ARPU for Indian telcos increased due to a growing mix of data (4G/5G) subscribers and strategic ARPU upliftment initiatives adopted by the telcos.
Revenue analysis of Global telcos: Q1-2024
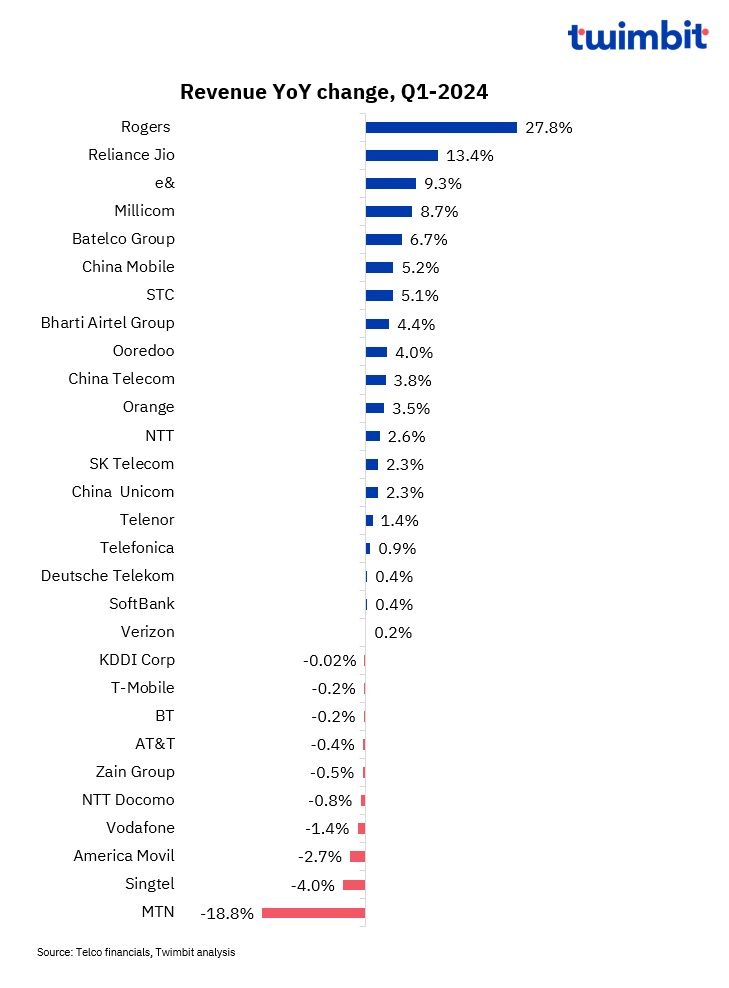
Average revenue growth for leading global telcos slowed from 3.9% in Q1-2023 to 2.5% in Q1-2024
Approximately 66% of telcos achieved YoY revenue growth in Q1-2024. The combined revenue of the 29 analysed telcos increased by ~USD 3.8 billion to ~USD 324.7 billion in Q1-2024, with 2 telcos exhibiting double-digit growth.
Exhibit 1: Revenue trends (% change) for Global telcos (YoY basis), Q1-2024
Rogers
Rogers Corporation (Rogers) achieved a 27.8% YoY revenue increase, reaching USD 3.6 billion (CAD 4.9 billion), driven by growth in wireless and cable segments.
- Wireless segment – Revenue increased by 7.7% YoY to reach USD 1.9 billion (CAD 2.5 billion) in Q1-2024, due to:
- Steady expansion in the overall mobile subscriber base.
- Successful acquisition of Shaw Mobile’s subscribers from the Shaw Mobile integration.
- A 4% revenue uptick in wireless equipment sales following a strategic shift in product mix and higher-value offerings.
- Cable segment – Revenue surged by 92.6% YoY to reach USD 1.5 billion (CAD 1.9 billion) in Q1-2024 driven by:
- Cable network expansion nearly doubled, with ~10 million homes gaining access.
- 8.5% YoY increase in ARPU (Average Revenue Per User) to USD 103.9 (CAD 140.1).
Reliance Jio
Reliance Jio revenue grew 13.4% YoY to reach USD ~3.5 billion (INR 288.7 billion) in Q1-2024. Key drivers include:
- 9.7% YoY increase in subscribers, reaching 481.1 million with 108 million+ 5G subscribers.
- Strategic initiatives such as the IPL Dhan Dhana Dhan plan, which offers two months of free services on recharge of Rs 234 for new JioBharat device users.
- Expanding JioAirFiber offering across ~5,900 cities and towns, with pan-India coverage planned soon.
- Selective and strategic adjustments in the mobile pricing options.
e&
e& Group recorded a 9.3% year-on-year revenue growth in Q1-2024, reaching USD 3.9 billion ((AED 14.2 billion), driven by robust performance across all operating segments, including the newly established digital verticals, e& enterprise and e& life.
- e& – UAE contributed USD 2.2 billion (AED 8.2 billion) in revenue in Q1-2024, marking a 5.7% year-on-year increase. This growth was fueled by expansion in both mobile and fixed services, complemented by the successful launch of new offerings like Business Pro and Home Wireless.
- e& – international segment demonstrated strong performance, with revenue climbing 8.4% year-on-year to USD 1.4 billion (AED 5.1 billion). This uptick was driven by growth across all key markets, including Maroc Telecom, e& – Egypt, PTCL Group, and Etisalat Afghanistan.
- The newly formed e& enterprise and e& life verticals exhibited exceptional growth. e& enterprise revenue surged approximately 21% year-on-year to USD 187.6 million (AED 689 million), underpinned by organic and inorganic expansion across cloud services, cybersecurity, and IoT. e& life revenue soared nearly 57% year-on-year to USD 121.7 million (AED 447 million), on account of the recent consolidation of Careem Everything App.
Millicom
Millicom’s revenue rose 8.7% YoY in Q1-2024 to USD 1.5 billion, driven by revenue growth across its operating regions except Bolivia, where the revenue growth was nearly flat.
- Mobile service revenue increased 9.1% YoY to USD 787 million.
- Fixed and other services revenue grew 8.8% YoY to USD 572 million.
Batelco
Batelco’s overall revenue increased 6.7% YoY in Q1-2024 to USD 293.1 (BHD 110.5 million) with growth across all reporting segments (Bahrain, Jordan, Maldives, Sure Group).
- Mobile telecommunications grew 6.3% YoY to USD 138.5 million (BHD 52.2 million), making it the largest revenue segment at 47.2%.
- Data communications circuit revenue increased 9.8% YoY to USD 47 million (BHD 17.7 million).
- Fixed broadband revenue declined 5.5% YoY to USD 50 million (BHD 18.8 million).
- Fixed-line telecommunication services revenue fell 6.1% YoY to USD 11.7 million (BHD 4.39 million).
- Wholesale services revenue decreased 0.6% YoY to USD 20.5 million (BHD 7.73 million).
China Mobile
Revenue grew 5.2% YoY to USD 36.8 billion (CNY 263.7 billion) in Q1-2024, driven by efforts to increase mobile subscribers and ARPU.
- Mobile subscribers increased 0.5% YoY to reach 996 million, with 5G package customers rising 0.5% YoY to 799 million.
- ARPU increased by 6.7% YoY to USD 6.7 (CNY 47.9).
STC
Revenue increased 5.1% YoY in Q1-2024 to USD 5.1 billion (SAR 19.1 billion), with growth across all business segments, including Saudi Arabia (KSA).
- Revenues inside KSA grew ~4.1% YoY to USD 4.9 million (SAR 16.7 million).
- Revenues outside KSA increased 13.3% YoY to 0.6 million (SAR 2.3 million).
MTN
MTN Group’s revenue declined 18.8% YoY in Q1-2024 to USD 2.3 billion (ZAR 42.9 billion), due to:
- Voice revenue decreased 32.2% (down 1.4%).
- Data revenue decreased 14.7% (up 20.2%).
- Fintech revenue increased 11.4% (up 25.0%).
MTN group service revenues increased in South Africa, but it declined in Nigeria in Q1-2024.
- South Africa: 3% YoY increase to USD 0.6 million (ZAR 10.4 billion).
- Nigeria: 52.8% YoY decline to USD 0.5 billion (ZAR 10.2 billion).
Singtel
Singtel Group revenue declined 4.0% YoY to USD 2.6 billion (SGD 3.5 billion) in Q1-2024 due to:
- Absence of contributions from Trustwave.
- Depreciation of the Australian Dollar (AUD).
EBITDA analysis of Global telcos: Q1-2024
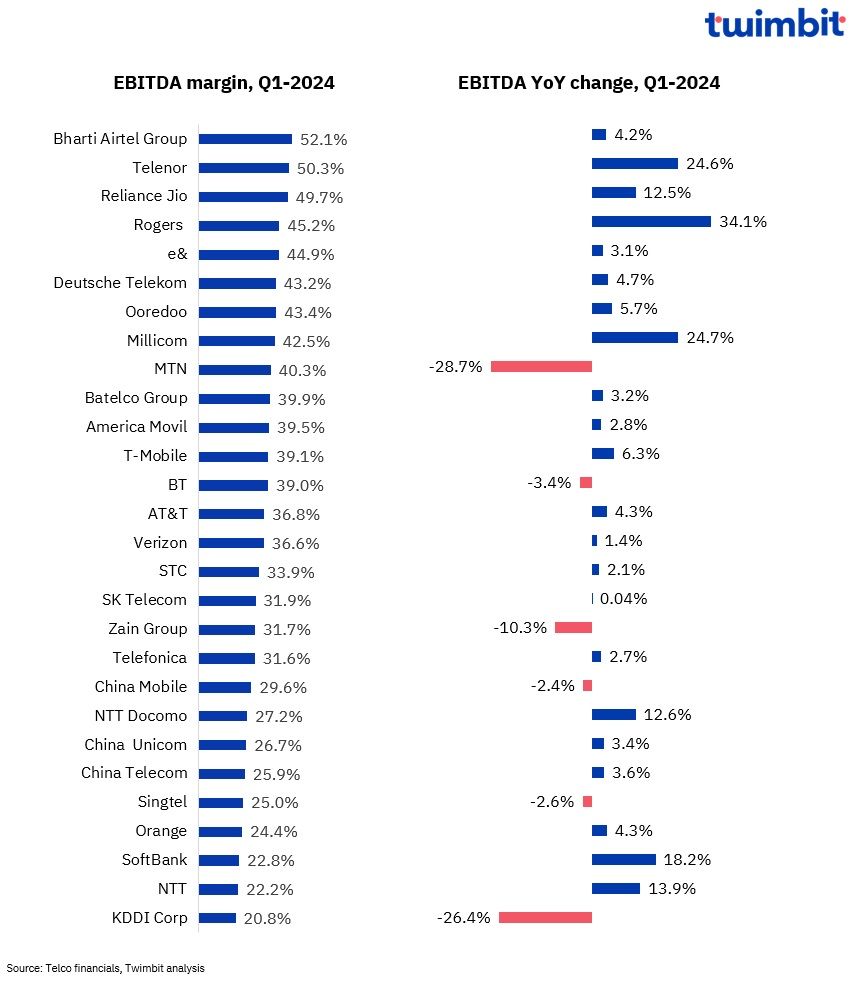
Average EBITDA margin for the leading global telcos stabilised at 34% in Q1-2024
Cost control measures, operational efficiency initiatives, and sustained top-line growth have stabilized EBITDA for ~79% of the analysed telcos. Nearly ~7 % of telcos reported a slight EBITDA decline, within a manageable range of around 3%.
Exhibit 2: EBITDA and EBITDA margin trends for Global telcos, Q1-2024
Rogers
Rogers’ EBITDA surged 34.1% YoY to USD 1.6 billion (CAD 2.2 billion) in Q1-2024 driven by enhanced synergies and efficiencies across its wireless, cable, and media segments.
- Wireless: EBITDA rose 7.7% YoY to USD 1 billion (CAD 1.2 billion), benefiting from increased revenue.
- Cable: EBITDA soared 97.5% YoY to USD 0.8 million (CAD 1.1 billion), driven by higher revenue and achieved cost synergies from integration efforts.
- Media: Adjusted EBITDA declined 171% YoY in Q1-2024 due to reduced revenue, increased programming and production costs related to broadcast timing, and higher expenses for the Toronto Blue Jays stadium.
The strong performance across these segments lifted the overall EBITDA margin by 210 bps to 45.2% YoY in Q1-2024.
Millicom
Millicom’s EBITDA surged 24.7% YoY to reach USD 632 million in Q1-2024, driven by organic growth of 20% across all countries, with increases ranging from 8% to 26%.
- Colombia achieved a new record EBITDA margin, expected to sustain positive and sustainable EFCF.
- Guatemala returned to positive service revenue and EBITDA growth, supported by improved mobile pricing.
The EBITDA margin expanded by 550 bps to 42.5% YoY in Q1-2024.
Telenor
Telenor Group’s EBITDA rose 24.6% YoY to USD 930.4 million (NOK 9.8 billion) in Q1-2024.
- The Nordic business area achieved a 5% organic growth in service revenues while maintaining flat operational expenses, resulting in a significant 8% increase in EBITDA.
- EBITDA in Asia grew by 5.3% YoY despite a 28% rise in energy costs.
Consequently, the overall EBITDA margin increased by 940 bps YoY to reach 50.3% in Q1-2024.
Softbank
Softbank’s EBITDA increased by 18.2% YoY to reach USD 2.4 billion (JPY 358.6 trillion) in Q1-2024, driven by a decrease in capital expenditure.
- Capital expenditure declined 24.8% YoY to USD 6.7 million (JPY 100.1 billion), contributing to a 340 bps increase in the overall EBITDA margin to 22.8% in Q1-2024.
NTT
NTT’s EBITDA surged 22.0% YoY to USD 5.5 billion (JPY 813.5 trillion) in Q1-2024 driven by several factors:
- Operating expense decreased 1.1% to USD 21.7 million (JPY 3.22 trillion).
- Overall operating profits increased 41.7% to USD 2.9 million (JPY 436.7 billion).
- Depreciation and Amortization (D&A) contributed 5.1% amounting to USD 2.5 million (JPY 376.8 billion).
As a result, EBITDA margin expanded by 350 bps YoY to 22.2% in Q1-2024.
MTN
MTN’s EBITDA decreased 28.7% YoY to USD 916.9 million (ZAR 17.3 billion) in Q1-2024.
- EBITDA from South Africa declined 0.8% YoY to USD 0.2 million (ZAR 4.5 billion).
- EBITDA from Nigeria declined 64.8% YoY to USD 0.2 million (ZAR 4.1 billion).
- Costs were pressured upward by inflation and FOREX depreciation, primarily impacting Nigeria.
- MTN SA faced increased expenses for network resilience and electricity tariff escalations.
- Operational inefficiencies were exacerbated by the Sudan conflict.
These factors led to a decline in the EBITDA margin by 560 bps YoY to 40.3% in Q1-2024.
KDDI Corp
KDDI’s EBITDA fell 26.4% YoY to ~USD 2.1 billion (JPY 309.3 billion) in Q1-2024, primarily due to decreased operating income.
- SG&A (Selling, General, and Administrative) expenses rose by 27.7% YoY to USD 3.2 billion (JPY 473.8 billion).
As a result, the EBITDA margin declined from 28.2% in Q1-2023 to 20.8% in Q1-2024.
BT
British Telecom’s EBITDA declined by 3.4% YoY to USD 2.5 billion (GBP 1.9 billion) in Q1-2024, a ~3% decline on a pro forma basis.
Despite this, growth in the consumer and Openreach segments offset the decline in the business segment.
- Consumer: EBITDA increased ~9% YoY to USD 842.1 million (GBP 664 million).
- Openreach: EBITDA increased ~2% YoY to USD 1.2 billion (GBP 923 million).
- Business: EBITDA declined 24% YoY to USD 533.9 million (GBP 421 million).
These factors led to an overall EBITDA margin decline of 130 bps to 38.9% in Q1-2024.
Zain Group
Zain’s Group EBITDA declined 10.3% YoY to USD 481 million (KWD 148 million) in Q1-2024, primarily due to an ~86% YoY EBITDA decline in Sudan to USD 12 million. Consequently, the EBITDA margin declined by 350bps YoY to 31.7% in Q1-2024.
CAPEX analysis of Global telcos: Q1-2024
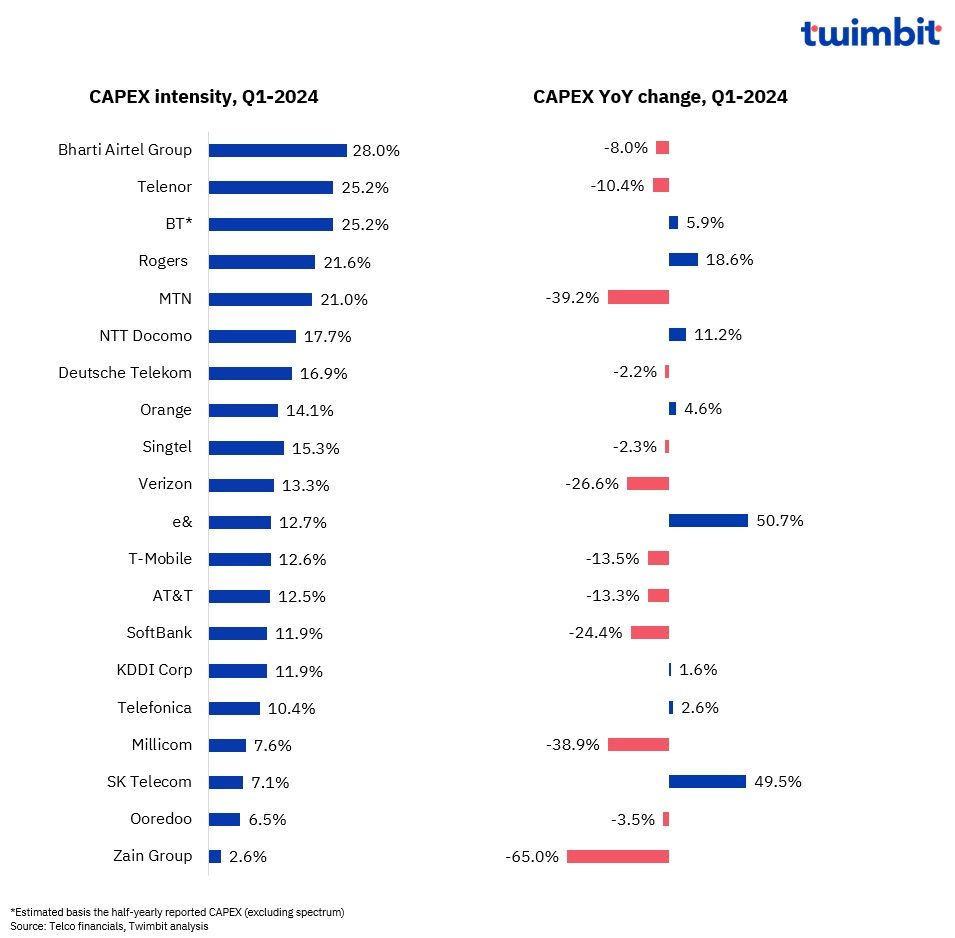
Average CAPEX intensity declined to 14.5% as 4G/5G network deployment of leading telcos reaches completion
Nearly 62% of the 21 telcos analysed reported a YoY CAPEX decline in Q1-2024, up from ~50% in Q1-2023. The maturation of 4G and 5G network rollouts in major markets like the US, India, Europe, and Japan is expected to lead to CAPEX stabilization or decrease in upcoming years.
Exhibit 3: CAPEX and CAPEX intensity trends for Global telcos, Q1-2024
e&
CAPEX increased 50.7% YoY to USD 450.1 million (AED 1.6 billion) in Q1-2024 driven by relatively higher growth rate in CAPEX spend as compared to overall revenue, as the telco continued to focus on network modernisation and deployment of latest technologies.
CAPEX spending increased across the operating segments e& – UAE, Maroc Telcom and PTCL Group during the period. As a result, CAPEX intensity increased from 8.4% in Q1-2023 to 12.7% in Q1-2024.
SK Telecom
Focusing on its AI Pyramid Strategy and AI integration in its data center business led to a 49.5% YoY CAPEX increase to USD 238.5 million (KRW 317 billion) in Q1-2024. As a result, CAPEX intensity rose from 4.8% in Q1-2023 to 7.1% in Q1-2024.
Rogers
CAPEX increased 28.6% YoY to USD 784.6 million (CAD 1.1 billion) in Q1-2024 due to continued cable network investments and network footprint expansion.
- Cable: CAPEX spending rose 50.5% YoY to ~USD 400 million (CAD 480 million) due to the Shaw acquisition, cable infrastructure investments, and additional fibre deployments to expand FTTH distribution.
- Media: CAPEX spending increased 96.7% YoY to USD 90 million (CAD 120 million) due to higher infrastructure-related expenditures for the Toronto Blue Jays stadium as part of the second phase of the Rogers Centre modernization project.
- Wireless: CAPEX spending declined 10.6% YoY to ~USD 300 million (CAD 404 million) due to the timing of investments in network development and 5G deployment to expand the wireless network.
The increased CAPEX spending in the cable and media segments offset the minor decline in the wireless segment. Higher revenues also offset the CAPEX intensity, which decreased from 37.4% in Q1-2023 to 18.6% in Q1-2024.
NTT Docomo
Continued AI and IoT investments to fulfil customer demand have led to a 17.7% YoY increase in CAPEX to USD 1.9 billion (JPY 286.9 billion) in Q1-2024. Consequently, CAPEX intensity rose from 15.8% in Q1-2023 to 17.7% in Q1-2024.
BT
CAPEX grew 5.9% YoY to USD 1.6 billion (GBP 1.3 billion) in Q1-2024, driven by increased spending in Consumer and Openreach segments.
As a result, the CAPEX intensity increased from 23.7% in Q1-2023 to 25.2% in Q1-2024.
Orange
CAPEX grew 4.6% YoY to USD 1.4 billion (EUR 1.5 billion) in Q1-2024, driven by a 5.2% YoY increase in telecom activities expenses to USD 1.5 billion (EUR 1.4 billion).
This increase raised CAPEX intensity from 12.5% in Q1-2023 to 14.1% in Q1-2024.
Zain
Following substantial CAPEX spending in Sudan during Q1-2023 including network expansion and spectrum acquisition, CAPEX declined 65% YoY to USD 39.1 million (KWD 12 million) in Q1-2024.
Consequently, CAPEX intensity decreased from 7.3% in Q1-2023 to 2.6% in Q1-2024.
MTN
CAPEX declined 39.2% YoY to USD 476.9 million (ZAR 9 billion), due to the completion of the network resilience plan rollout by MTN SA.
Consequently, CAPEX intensity decreased from ~28% in Q1-2023 to ~21% in Q1-2024.
Millicom
Continued optimization across all operations has led to a 38.9% YoY decline in CAPEX to USD 113 million in Q1-2024. The decline also resulted from the phrasing of its FY-2024 investment plans compared to FY-2023.
Consequently, CAPEX intensity decreased from 13.5% in Q1-2023 to 7.6% in Q1-2024.
Verizon
CAPEX declined 26.6% YoY to USD 4.4 billion in Q1-2024 due to the completion of its accelerated USD 10 billion capital program related to the C-Band deployment in H1-2023.
Consequently, CAPEX intensity declined from 18.1% in Q1-2023 to 13.3% in Q1-2024.
ARPU analysis of Global telcos: Q1-2024
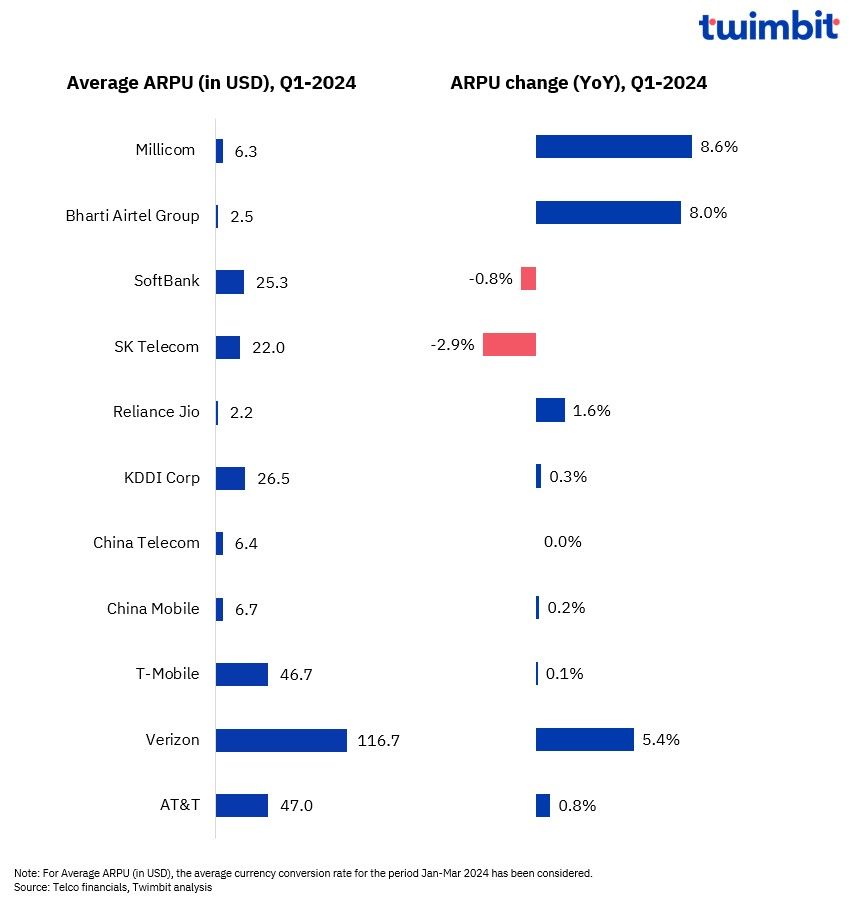
The average ARPU level witnessed a modest growth of 2.1% YoY to USD 28 in Q1-2024
- The growing data (4G/5G) subscriber mix and strategic ARPU upliftment initiatives have increased ARPU for Indian telcos.
- Healthy postpaid subscriber contributions resulted in the ARPU growth for the telcos in the Americas, including Verizon and Millicom.
Exhibit 4: ARPU trends for Global telcos, Q1-2024
Millicom
ARPU increased 8.6% YoY to USD 6.3 in Q1-2024, driven by:
- Growth in local currency terms across all operating countries.
- A 6.6% YoY increase in 4G customers, reaching 22.3 million.
- A 12.1% YoY increase in postpaid subscribers reaching 7.3 million.
Bharti Airtel Group
ARPU in India increased 8% YoY to USD 2.5 (INR 209) in Q1-2024 due to strategic and selective ARPU upliftment strategies.
- The 4G subscriber contribution to the overall subscriber count rose from 66.8% in Q1-2023 to 71.8% in Q1-2024.
ARPU for Africa increased 11.1% YoY to USD 2.6 in Q1-2024.
- Data customers increased 18.1% YoY to 64.3 million in Q1-2024.
- The share of data customers to overall customers grew from 39% in Q1-2023 to 42.8% in Q1-2024.
Verizon
ARPU increased 5.4% YoY to USD 116.7 in Q1-2024, driven primarily by improvements in subscriber count across its wireless retail segment.
The postpaid subscriber count increased 1.9% YoY to 93.9 million, offsetting a 6.4% YoY decline in the prepaid subscriber count. Additionally, the ARPU increased by:
- Wireless retail postpaid: 4.4% YoY increase to USD 135.7.
- Wireless retail prepaid: 1.5% YoY increase to USD 31.2.
Reliance Jio
ARPU increased by 1.6% to USD 2.2 (INR 181.7), driven by a better subscriber mix and selective and strategic ARPU upliftment strategies.
- Reliance Jio reached a subscriber count of 481.8 million with 108 million being 5G subscribers.
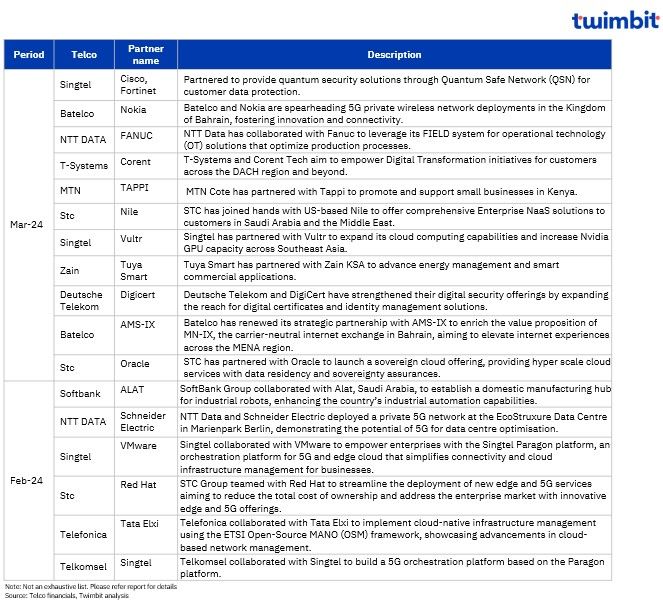
Key Partnerships: Q1-2024
Key focus areas of the collaborating telcos include 5G, IoT, Cloud computing, Blockchain, RAN technology, 5G orchestration, sub-sea cable connectivity, AI, etc.
Research Methodology and Assumptions
- The “Global telcos performance benchmarks: Spring 2024” report presents key findings on the performance of 30 strategically selected leading telcos across diverse geographies, offering a comprehensive global perspective on telco performance. Key performance metrics analysed include Revenue, EBITDA, CAPEX, and ARPU for the period January–March 2024.
- This report leverages data acquired from telecommunications companies and includes extensive secondary research. Twimbit adopted a calendar year approach for data analysis, where FY signifies the period from January to December.
- To ensure consistency and facilitate accurate comparisons, a constant currency conversion rate representing the average USD exchange rate for the period January–March 2024 has been applied throughout the report.
- The report presents a comprehensive assessment of Revenue and EBITDA for 29 and 28 telecommunication companies, respectively. Additionally, CAPEX and ARPU analyses encompass data from 20 and 11 telcos, respectively.
- Blended mobile ARPU has been incorporated wherever relevant to provide a more holistic view.
Click here for more contents on telecom
Recommended by Twimbit
Middle East telcos performance benchmarks – Spring 2024
APAC telcos performance benchmarks – Spring 2024
Thailand telecom market updates – 2024 edition