
Top 12 trends and best practices
Key Highlights
- Chinese banks are the most profitable in the APAC region, generating USD 794 billion in revenues.
- Central banks like RBI hiked the interest rates and loan yield more than the deposit rates to boost net interest incomes.
- Fee income grew at a CAGR of 5.97% between 2018 and 2022. As a result, the average fee income to total revenue stood at 12.07% in 2022; Mandiri, SCB and UOB Bank had the highest fee income to total revenue.
- BRI, AmBank and BCA recorded the highest decline in their cost to serve by 11.68%, 7.3%% and 6.24%, respectively, between 2018 and 2022.
- Australian banks are the leaders in ICT spending, with average spending of USD 874 million in 2022, which accounted for 6.58% of the total revenue.
- APAC banks have an average ICT-to-Revenue ratio of 4.77%, which increased at a CAGR of 35.69% between 2018 and 2022.
- The average net profit for banks in APAC stood at 23.4% of the total revenue.
- APAC banks’ profitability reached a 14-year high in 2022 with an average return on equity of 11.77%, above the global range of 11.5-12.5%.
- Australian banks have an average LDR of 106.2%, except ANZ, which was at 84.3%, falling within the ideal range of 80-90%.
- Customer preferences are shifting from floating-rate loans to fixed-rate loans due to high volatility in interest rates.
- APAC banks have maintained an average CET-1 of 15.56% to create a sufficient buffer against economic uncertainty.
This report reviews the performance of the top 41 banks in the APAC region for 2022. Here, we break down 12 trends that can help banks become resilient and unlock growth.
Trend #1 APAC banks grew their revenue at an average of 5.11%, with more than 68% of banks indicating revenue growth.
The top 41 banks in APAC generated USD 1061.1 billion in revenues in 2022, with 53% of banks recording revenue growth from 2018 to 2022.
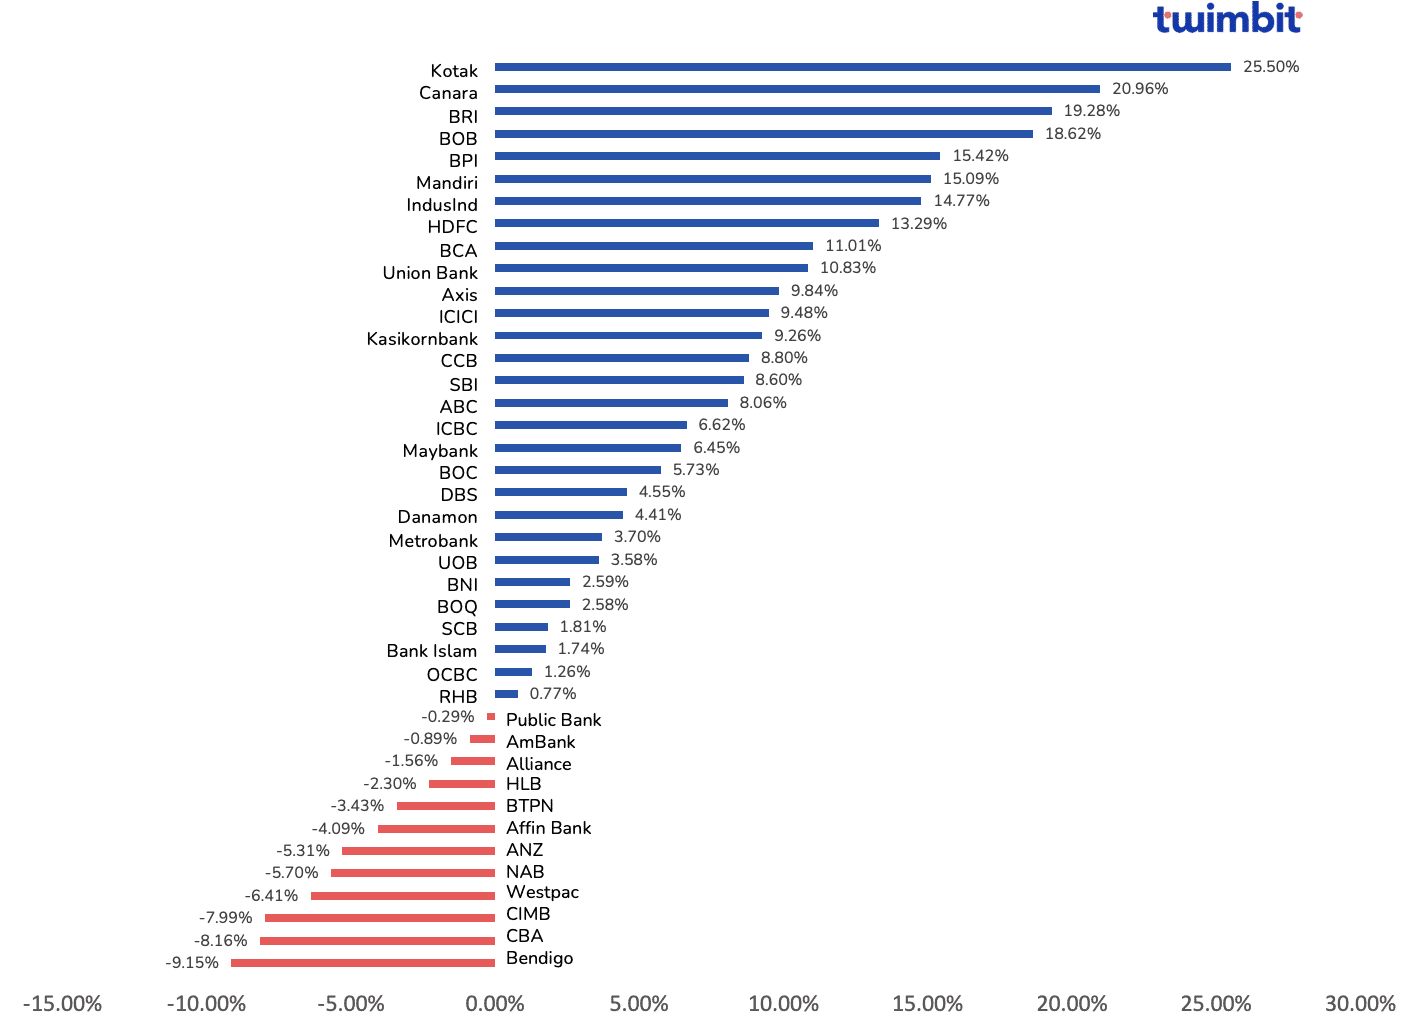
CAGR revenue growth from 2018 to 2022
- China
- Most profitable among the 41 banks
- Generated USD 763 billion in revenues
- Accounted for 69% of total revenue in APAC in 2022
China achieved this despite being on the lower spectrum of revenue growth with a CAGR of 7.3%.
- The Philippines
- Union Bank recorded a growth of 10.83% (Exhibit 1)
- Net interest income increased by 14.24%
- Fee-based income increased by 33.89%
Currently, the fee-based income, a post-acquisition of the Citibank consumer, stands at USD 93 million, a notable achievement for the Philippines, representing a significant increase compared to the previous year.
- India
- Strong earnings momentum with a CAGR growth of 15.13%
- International Monetary Fund (IMF) projects a GDP increase of 6.1% in 2023, compared to its 2.9% expansion of the world economy.
Currently, India’s one of the fastest-growing economies worldwide. For instance, the notable factors in India’s CAGR increase include declining credit losses and non-performing loans. In addition, the higher interest rates that boost the net interest margin and decade-high return on assets are also vital factors to its CAGR growth.
- Australia
- Australian banks record an overall decline in revenue
- Bendigo, CBA and Westpac charted an average 7.9% decline
This situation is due to declining net interest margins driven by low-interest rates, intense market competition and an unfavourable shift towards fixed-rate mortgage loans.
Trend #2 Interest rate hikes by central banks led to a 1% drop in the Net Interest Margins for APAC banks
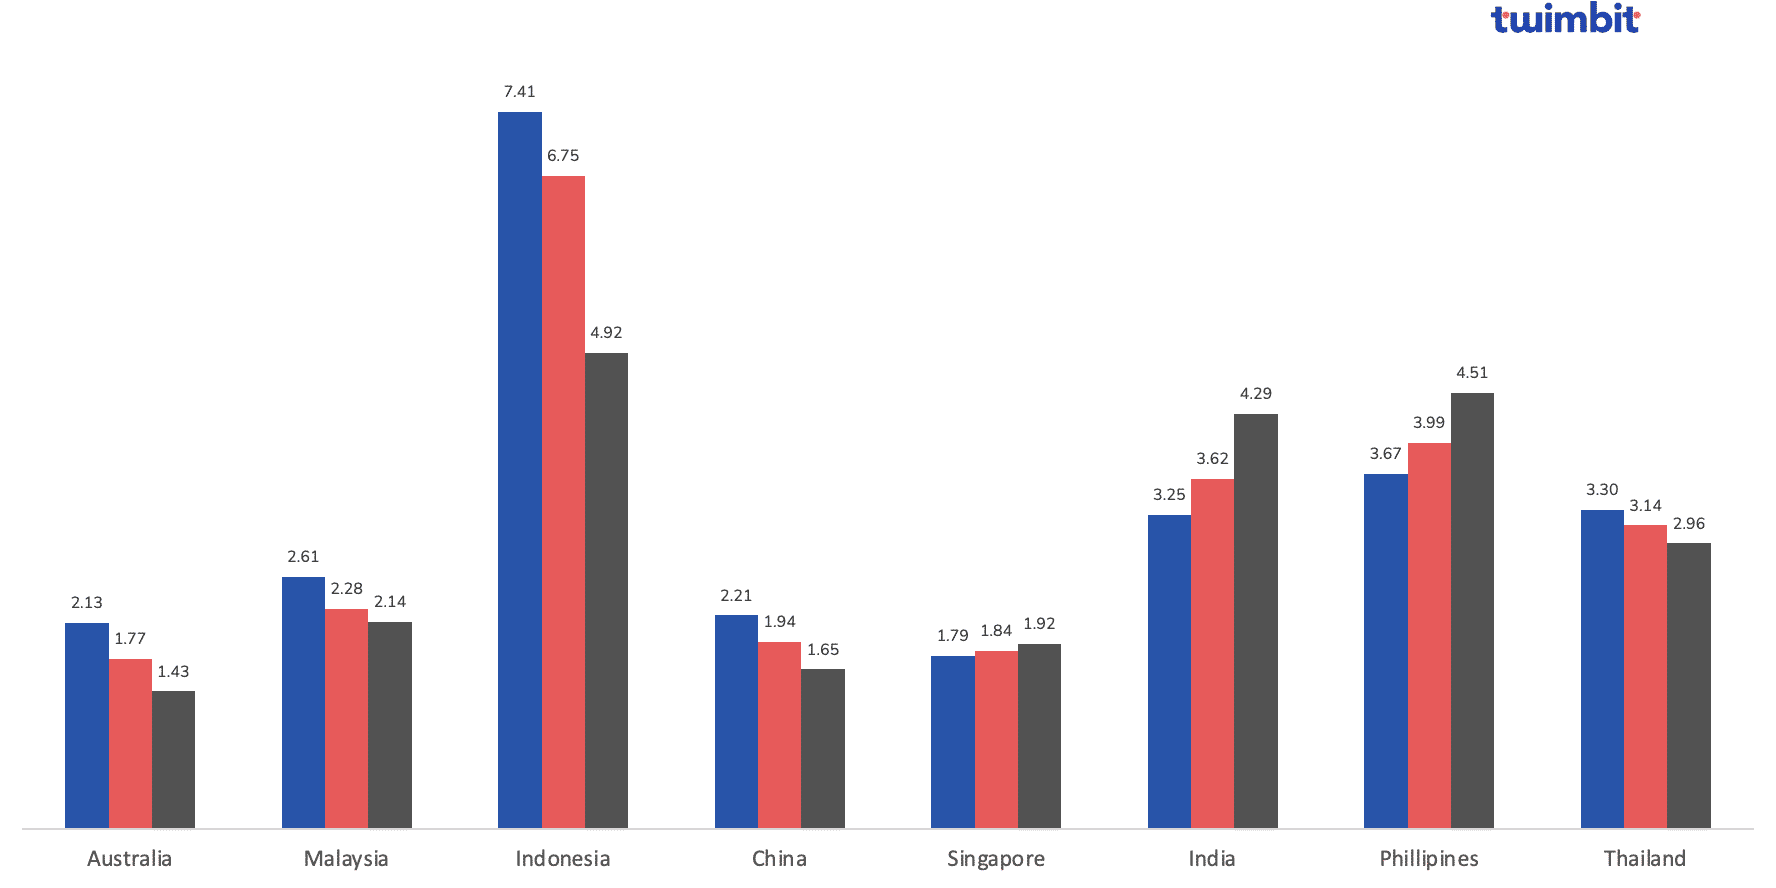
Changes in Net Interest Margin from 2018 to 2022, forecast for 2027
The average Net Interest Margin (NIM) achieved by the top 41 banks in APAC stood at 3.01% in 2022 compared to 3.18% in 2018. 58% of the banks analysed reported a decline in their NIM by a CAGR of 4.36%.
Australian banks witnessed the maximum decline in NIM at 4.27% due to the following:
- Lower home loan margins
- Continued pricing pressure on mortgages
- Change in customer preferences for fixed-rate loans over floating-rate loans and a higher balance of lower-yielding liquid assets.
Indian banks recorded the highest growth at 3.30% due to the following:
- A surge in credit
- Higher lending rate by the RBI
- No rise in the cost of holding deposits.
Currently, home loans comprise 48% of all floating-rate loans in India. The banks stretched the tenure of home loans to keep the EMIs intact, thereby reducing the default rate during COVID-19. On the other hand, banks continue to disburse more loans because deposits are increasing. For instance, HDFC recently announced that its deposits grew by 20.8% in Q4 FY2022-23.
Previously, low-interest rates over the past decade have hindered the banks’ performance, leading to a period of low-interest margins. Thus, the hike in interest rates by the central banks of various countries across APAC should boost the NIM for banks. In the short run, loan yield is expected to outrun deposit rates.
Combine this with the rising interest rates, which may result in strong NIMs. However, the shift in consumer preference from floating-rate to fixed-rate loans could partially offset this result. For instance, the RBI hiked the repo rate in India, which the banks transferred directly to home loans, allowing them to maintain their NIMs.
Trend #3 Fee-based income grew by an average of 5.97% and accounted for 12.07% of total revenue in 2022
The top 41 banks in APAC generated USD 114 billion in fee income in 2022, with over 31% of banks recording a decline in fee income between 2018 and 2022. As a result, the current fee income to total revenue stands at 12.07%.
Realising the need to reduce their reliance on interest income, banks must formulate new ways to generate revenue through sources other than interest income. Also, the continuous decline in interest margins has incentivised banks to shift their focus to non-interest income in two ways:
- Integrating hybrid working models and technologies through phygital branches such as virtual reality
- Growth opportunities with open finance, such as BaaS (banking as a service), embedded finance, super apps and marketplaces
- The Federal Bank in India is capitalising on BaaS by partnering with more than 50 fintech and offering them their 300+ APIs in 13 API bundles
- HDFC’s payment products account for 30% of its total fee income.
- BRI has an API-driven digital partnership model to connect with fintech and create digital ecosystems for data monetisation
- DBS established an online Car Marketplace in 2017, followed by Electricity Marketplace in 2018, and has since expanded into property, health, education, travel and home & living marketplaces.
Many expected that license fees associated with these models would help generate a portion of the fee income. As a result, the fee income to total revenue is expected to reach 12.73% by 2027.
Most Australian banks have the highest decline in their fee incomes. The primary driver is the decreased fee income from household products which has declined since 2018, and the reduction or removal of feels on certain products, partly in response to the 2018 Royal Commission.
Meanwhile, household fee income decreased by 3% in 2022 compared to 2021 due to the competition for housing loans that are driven by competitive pricing, low margins, and ease of shifting mortgages from one bank to another. As of 2021, only 541,000 owner-owned mortgages opened or were financed to a different bank yearly out of the estimated 3.9 million in Australia. The primary reason for the shift is interest rates and fees charged by the banks.
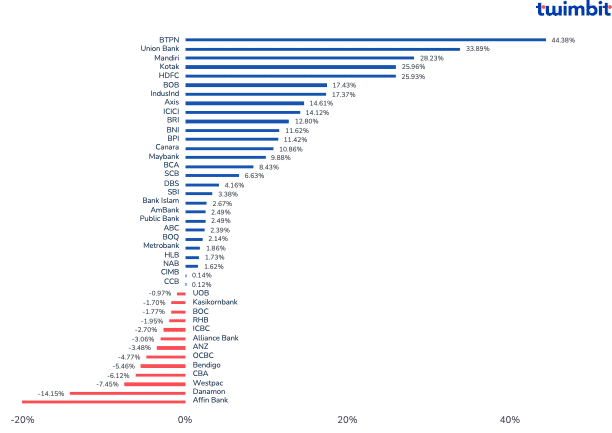
CAGR fee income growth from 2018 to 2022
As per our analysis, banks with new fee income streams, rising ICT spending and digitised business models are expected to grow faster than peers over the next 5 years. The primary growth drivers for the rise in fee income in the APAC region are fees generated through investment banking, brokerage, insurance and service charges.
Banks are also beginning to adopt capital-light and more fee-oriented models. In addition, the decline in interest rates has led to a loss in loan revenue, leading the shift towards fee income in segments on insurance and wealth and asset management, which are continuously growing in the APAC region.
Trend #4 OPEX for APAC banks grew by 6.3%, driven by increased spending on branch expansion and IT expense
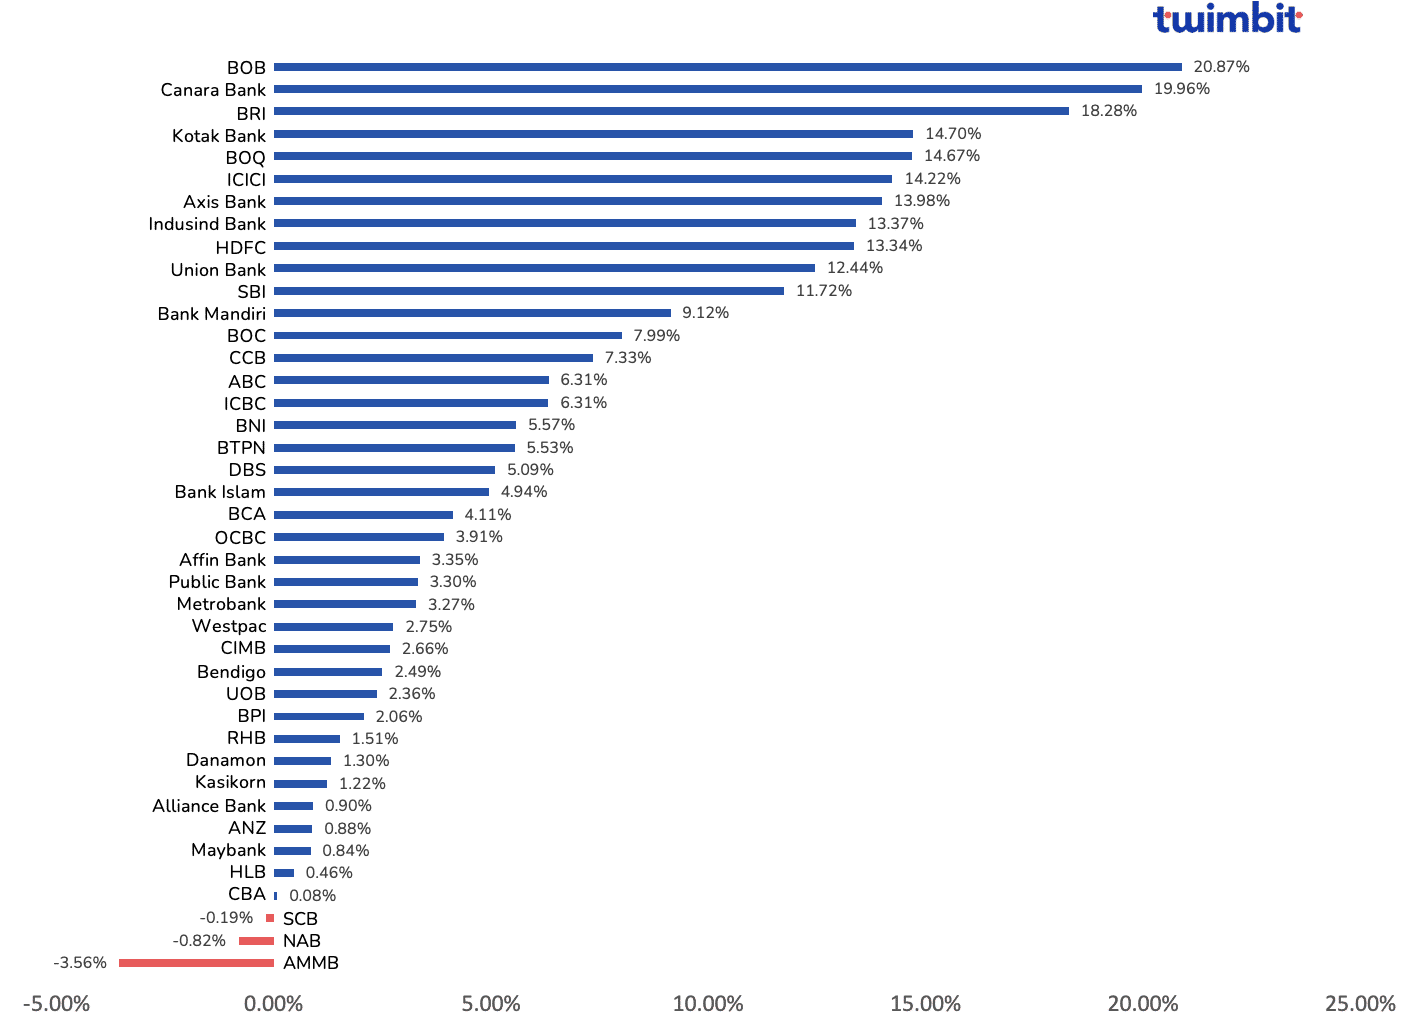
CAGR operating expense growth from 2018 to 2022
The average operating expense (OPEX) recorded by APAC banks in 2022 stood at USD 6.25 billion.
- SCB reduced its OPEX from USD 1848 million to USD 1834 million
- NAB reduced its OPEX from USD 6,249 million to USD 6,047 million
- AmBank reduced its OPEX from USD 551 million to USD 477 million
- India
- Highest OPEX increase, with an average increase of 15.27% among the 8 banks analysed.
- The Bank of Baroda and Canara Bank are at the top of the graph (Exhibit 4), with an increase of 20.87% and 19.96%, respectively.
- OPEX growth is exponential, charting at over two times the APAC average.
Currently, at least 8 of the top 11 banks in Exhibit 4 are Indian banks, which have experienced a maximum increase in their OPEX.
The primary drivers for the rise in OPEX:
- Constant technology updates by heavily modernising its core banking systems and integrating all banking functions into a single platform to improve speed and efficiency
- Banks also invest in compliance and regulatory technology to meet the increased regulatory requirements, such as investing in KYC and anti-money laundering (AML).
- HDFC Bank
- Implemented a hybrid cloud landing zone and API transformation program
- Improved its infrastructure security and resilience through data centre migration, AI and ML-based security and monitoring, as well as DR resiliency and orchestration automation
- ICICI Bank
- Made internal investments in AI-based data analytics to identify top profit pools and enable the cross-selling of products and asset growth
- Built a data platform in a unified cloud-based architecture with real-time data integration and hyper-personalised customer management
- DBS Bank
- Created over 100 AI/ML algorithms with over 250 use cases to serve over 3.5 million retail and wealth customers with 30 million hyper-personalised insights monthly in Singapore alone
- Branch expansion plans
The private sector banks in India increased their branch network from 14,893 in 2021 to 16,189 in 2022, with HDFC and Axis Bank accounting for the bulk of the growth at 734 and 164 branches, respectively.
As of 2022, HDFC Bank, the largest private sector bank in the country, has declared intentions to almostdouble its branch network by 2025 to 2027, with the annual addition of 1,500 to 2,000 new branches, putting pressure on their OPEX.
AmBank has achieved cost savings at a CAGR of 3.56%. The reduction in OPEX comes from the Mutual Separation Scheme (MSS) and the Business Efficiency Target 300 (BET300) that the bank introduced in 2018.
- MSS represents the bank’s shift in strategy and composition to cost restructure and concentrate more on the retail and business banking segments.
- BET300 represents the bank’s aim to generate USD 68.12 (RM300) million worth of savings for the three years following 2018. In 2021, the bank announced that it achieved the target and aimed to save a further USD 22.71 (RM100) million.
Trend #5 Cost efficiency for APAC banks is improving, with an average CE ratio of 45.29% in 2022 as compared to 47.03% in 2018
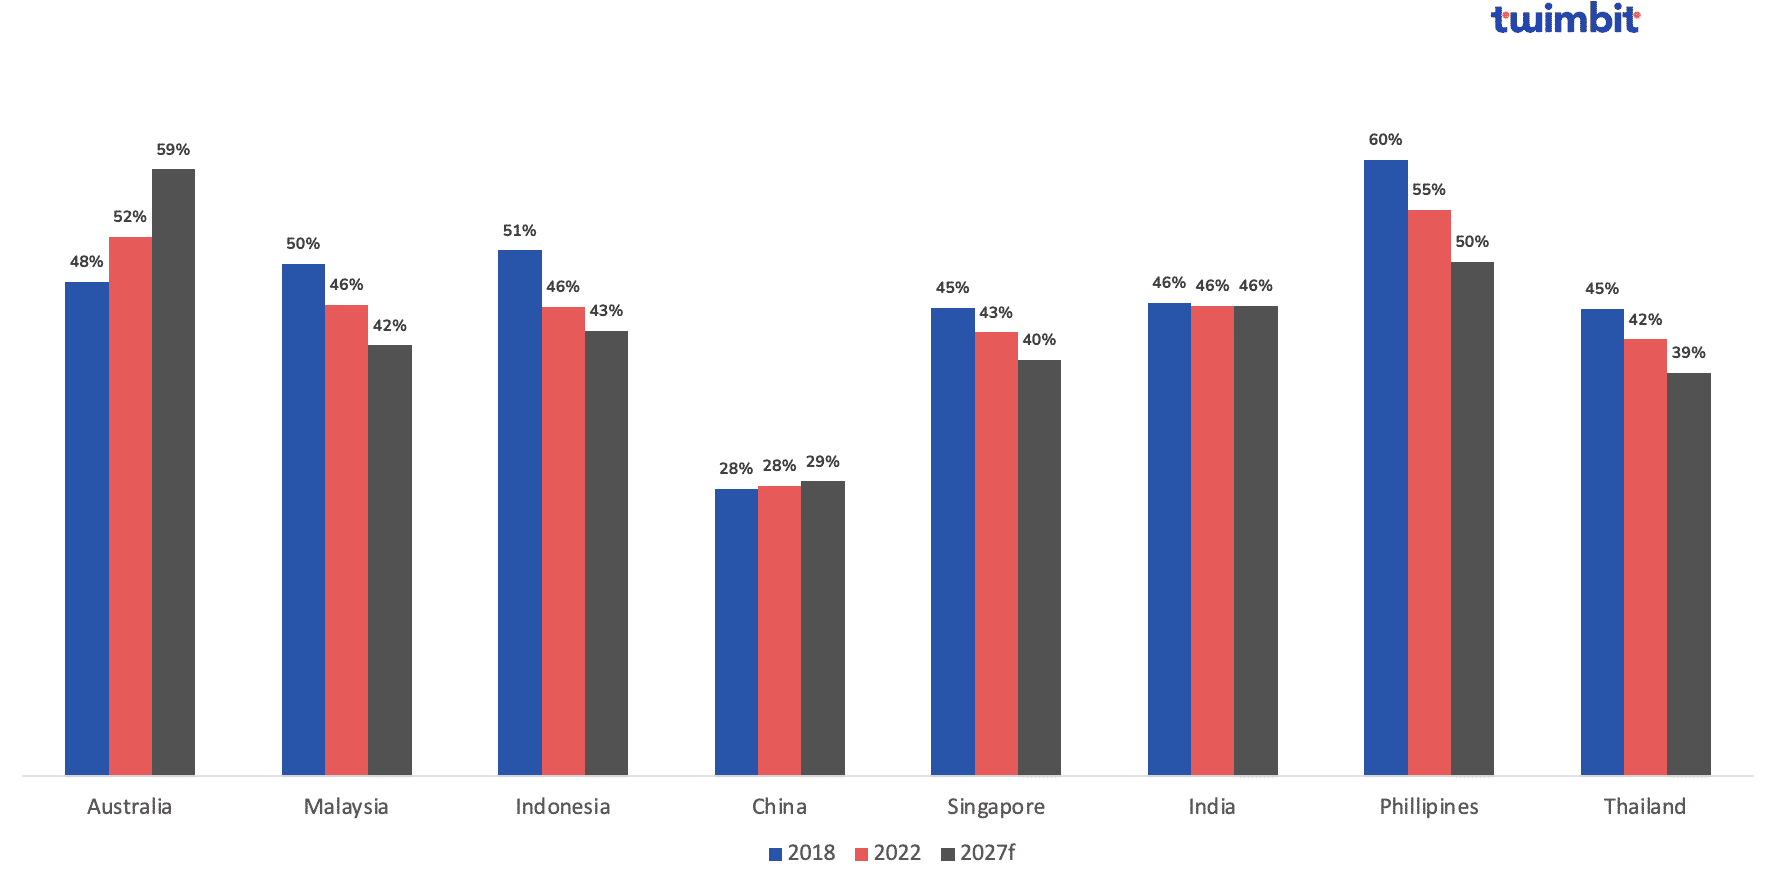
Changes in cost efficiency (CE) ratio from 2018 to 2022, forecast for 2027
Between 2018 and 2022, 23 out of 41 banks could reduce their CE ratio, and 19 could maintain it below the threshold value of 50%. BRI, Canara Bank, AmBank and Alliance Bank were able to get their CE ratio below the threshold value. However, Westpac, BOQ, ANZ and BTPN moved up against the threshold value.
Chinese banks have been the most efficient in their operations, with an average CE ratio of 28.22% in 2022 due to expansive branch networks and large customer bases, giving them the advantage of economies of scale. It also allows them to spread costs over their customer base, thereby reducing unit costs.
Combine this with the rapid technological advancements in operations and government support in the form of capital and liquidity, and it’s no surprise why these banks have achieved high levels of efficiency compared to peer banks in other APAC regions.
Banks with CE ratio between 30-40%: ABC, Public Bank, BCA, BTPN, HDFC, HLB and Bank Mandiri
Banks with CE ratio between 40-45%: ICICI, SCB, BNI, IndusInd, DBS, Kasikorn, UOB, Alliance, RHB, AmBank and OCBC
- BRI
BRI reduced its CE ratio the most, from 77.86% in 2018 to 47.38% in 2022, due to the following:
- Optimised branch network by closing branches with low footfall
- Opened branches in cost-effective high-growth areas
- Automated transaction processing and account opening
All of these initiatives by BRI have led to increased revenue and net profits, perfectly encapsulating its CE ratio of 47.38%.
- Westpac
Westpac increased its CE ratio from 43.79% in 2018 to 55% in 2022 due to incurring high costs. This can be due to the following factors:
- The regulatory requirements by APRA (Australian Prudential Regulatory Authority)
- The fallout from the Banking Royal Commission and increased scrutiny of the banking industry
Trend #6 ICT spending for APAC banks increased by 2.8%, mainly due to cloud investment and core modernisation
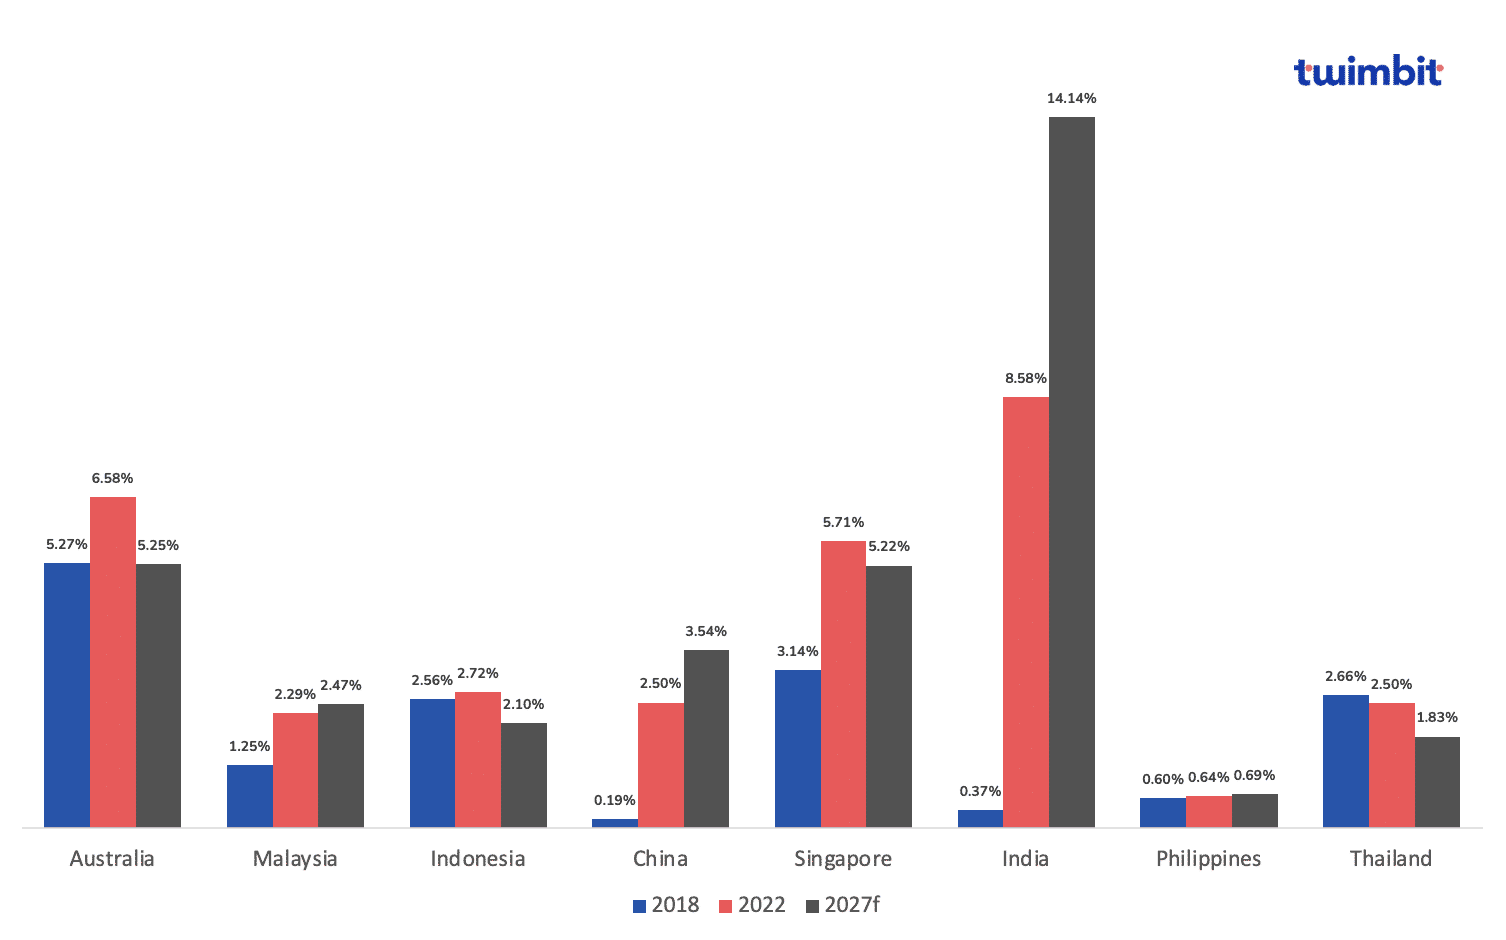
Changes in ICT to revenue from 2018 to 2022, forecast for 2027
As a percentage of revenue, ICT has grown by 36.49% from 2.32% in 2018 to 4.45% in 2022.
- Australia
- Highest ICT to revenue, with BOQ, Westpac, and CBA leading with 9.72%, 7.66%, and 5.85%, respectively.
On average, Australian banks spend 6.58% of their revenues on ICT.
- China
- Lowest ICT to revenue, with only 2.5% of revenue spent in 2022.
Although, in terms of dollar value, Chinese banks are only behind Australian and Singapore banks.
- Singapore
- ICT spending expects to almost double in 2023 compared to 2018.
Singapore banks often invest heavily in AI and big data to generate insights into customer spending behaviour.
The drive for the overall increase in ICT investments is due to the need to:
- Modernise business intelligence
- Augment customer analytics
- Improve robotic process automation (RPA)
- Expand open banking
- Heighten the customer experience
Trend #7 APAC banks record an annual increase of 11.66% in their net profits despite rising OPEX
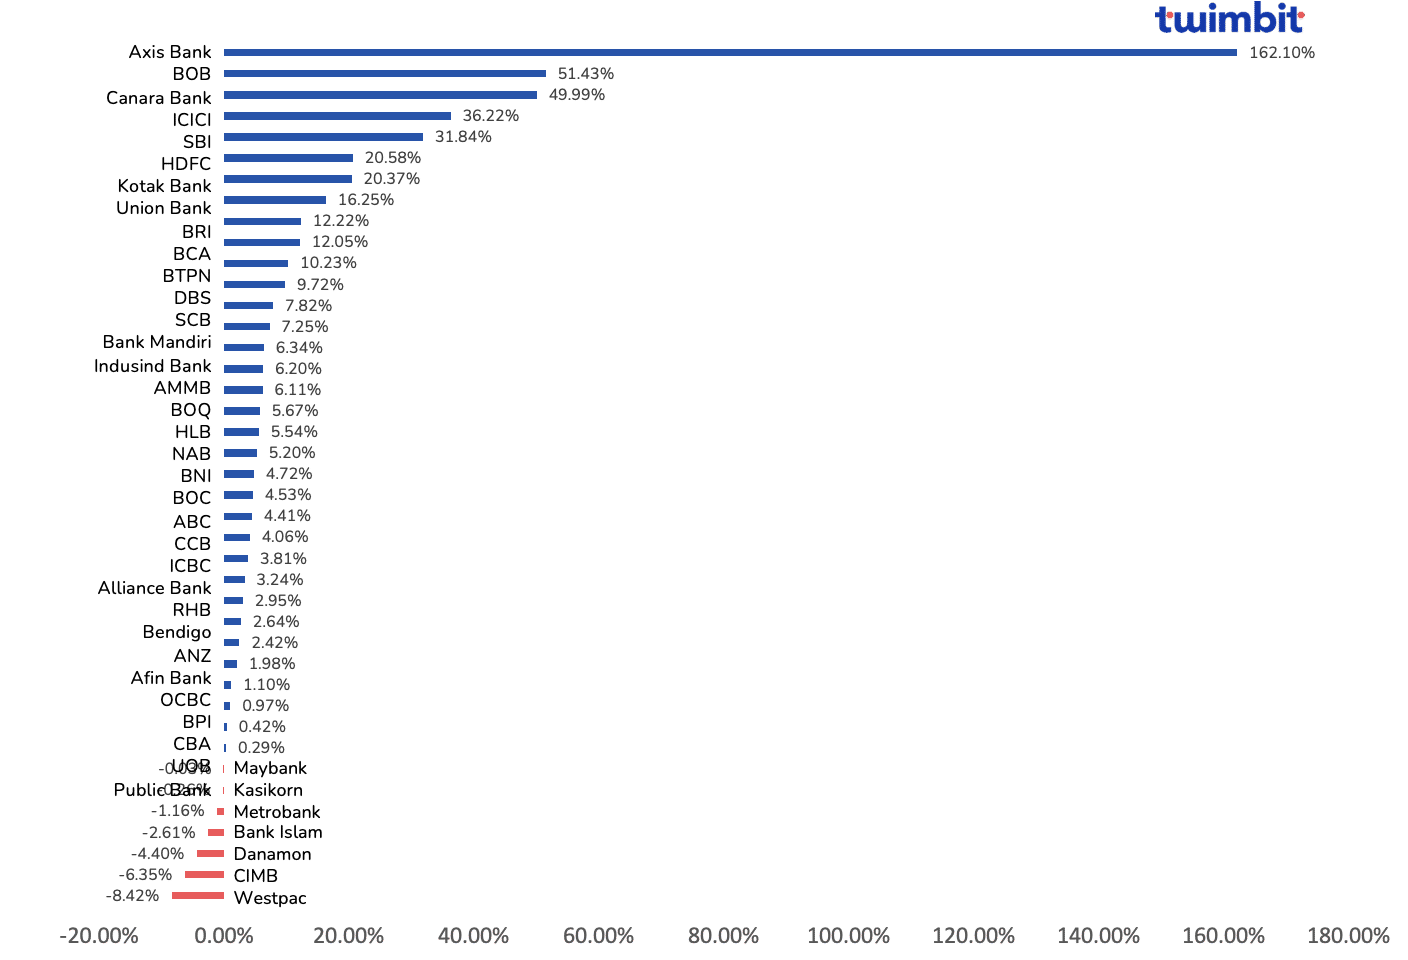
CAGR net profit growth from 2018 to 2022
The average net profit of the top 41 banks in APAC stood at USD 6.05 billion in 2022. However, out of the 41 banks analysed, only 7 recorded a decline, with Westpac leading the pack with an 8.42% decline.
- Westpac
Its net profit declined due to the following:
- The turnaround in impairment charges – such as the floods, the pandemic and geopolitical instability.
- The high prices and higher interest rates also affected consumer spending.
- The bank’s consumer and business banking division also recently reported a 23% decline in net income in the first half of 2022.
- CIMB
Its net profits declined due to provisions for expected credit losses as non-interest income falls.
- Axis Bank
Axis Bank continued to record a rise in operating expenses due to the following factors:
- Provisions and contingencies from non-performing assets increased by 27.7% from USD 1520 million to USD 1941 million.
- Operating expenses increased by 14.68% from USD 1520 to USD 1755 million*.
However, Axis Bank experienced a change of leadership in FY 2018-19. The shift in leadership indicated a turnaround in its profitability and cost structure, leading to its exponential net profit growth of 162.10% (Exhibit 7).
*Note – Axis Bank’s operating expenses increased because of its continued investment in branch infrastructure, technology and human capital. Although this increase helped support business growth, its operating revenues continued to decline by 0.67%, from USD 3736 million to USD 3711 million between 2017 and 2018.
- India
- Indian banks have the highest increase in net profits, with a CAGR of 47.36%.
- The average net profit is USD 2.06 billion, compared to the average annual profit of 43.01 billion recorded by Chinese banks.
- Growth by Indian banks is higher than banks in any other APAC region due to its credit surge of 20%*.
As per a report by the Reserve Bank of India (RBI), the credit growth accelerated to a 10-year high in the first half of FY2022-23.
Trend #8 ROE grew by 1.57%, implying profitability for APAC banks despite economic constraints
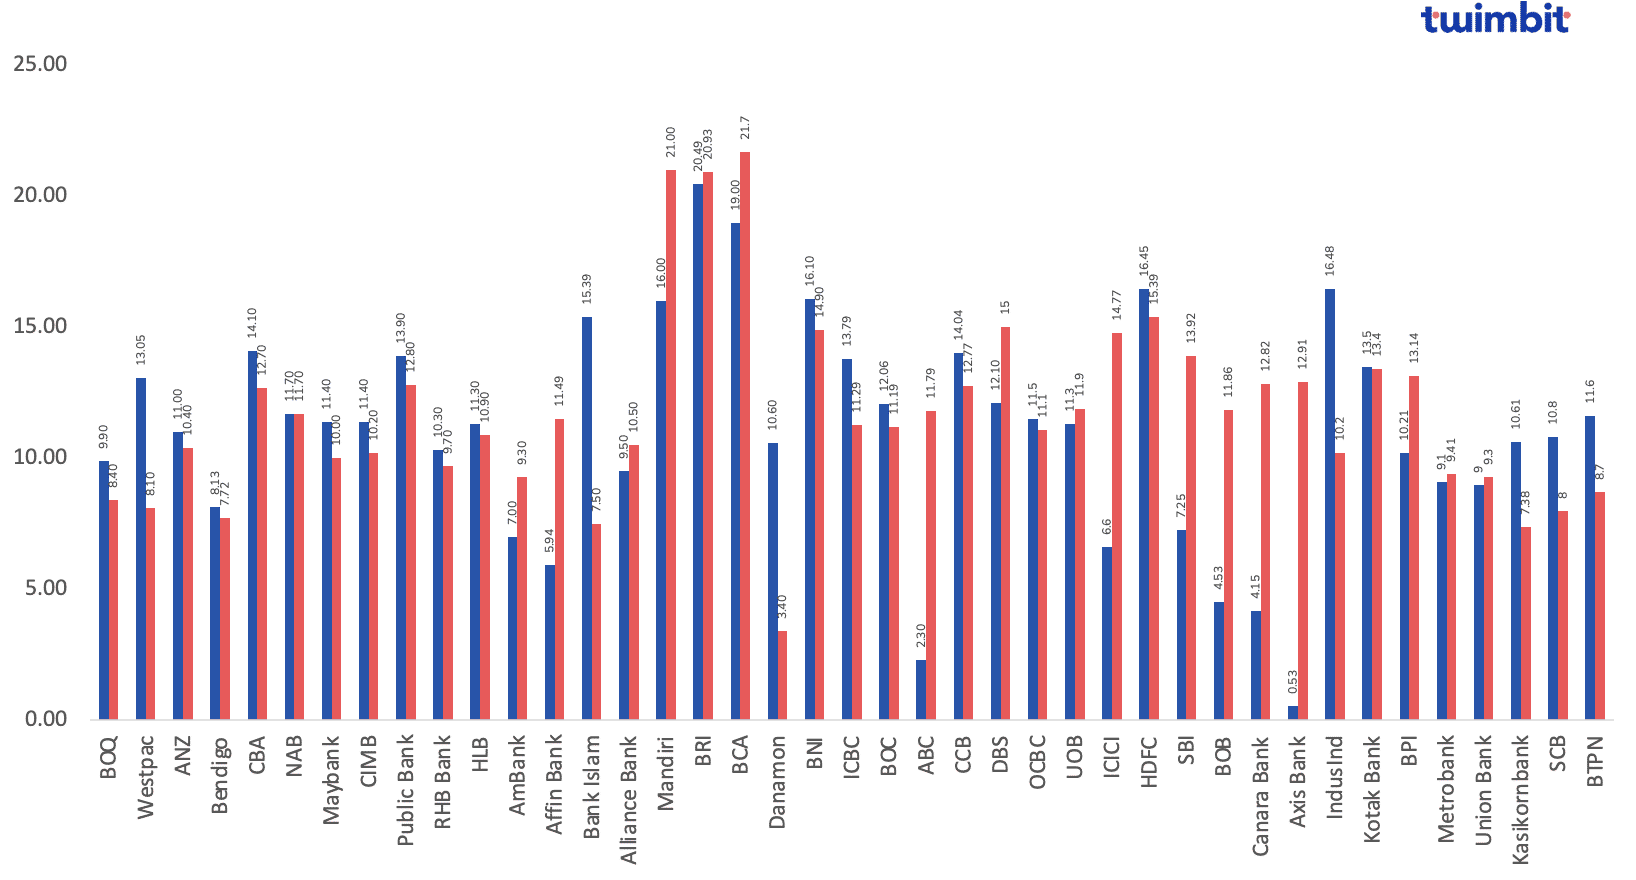
Changes in Return on Equity from 2018 to 2022
The top 41 banks’ average ROE (return on equity) in APAC remained almost constant, with less than a 1% increase from 2018 to 2022. However, Australian, Malaysian, Indonesian and Thai banks witnessed a decline in their ROE, whereas Chinese, Singaporean, Indian and Philippine banks recorded an increase.
- Thailand
Thailand reported the highest decline in their ROE between 2018 and 2022, with only accelerated growth, high profitability and value creation between 2009 and 2014.
- Assets and revenues experienced rapid growth, enabling a rising economy across all sectors, leading to an ROE rise to 20%, beating the industry average of 14%.
However, this economic growth phase was followed by an economic slowdown between 2015 and 2021, which led to slow growth, declining profits, shrinking value creation, higher household debt and portfolio rebalancing by Thai banks.
The decline in the performance of Thai banks was due to various factors.
- Yields were flattened by portfolio realignment towards low-yield assets. There was a climb in mortgages pending and a shift in loans pending from SMEs to corporate lending.
- Operational efficiency was slow due to banks’ slow digitalisation and technology adoption, combined with a sharp rise in expected credit losses.
These factors led to a 7.94% decline in the ROE for Thai banks.
- Australia
Following Thailand, Australia also reported declining ROE due to the following factors.
- Increased competition from new entrants
- The emergence of digital disruptors
- Lower interest rates by the Reserve Bank of Australia
India
Indian banks continue their digital adoption with robust banking strategies that help them maintain stable NIMs, LDR and fee income growth with an average service cost. This has led to an increase in their ROE from 8.69% to 13.16%.
Trend #9 APAC banks are on a spree towards declining their Loan-to-Deposit Ratio
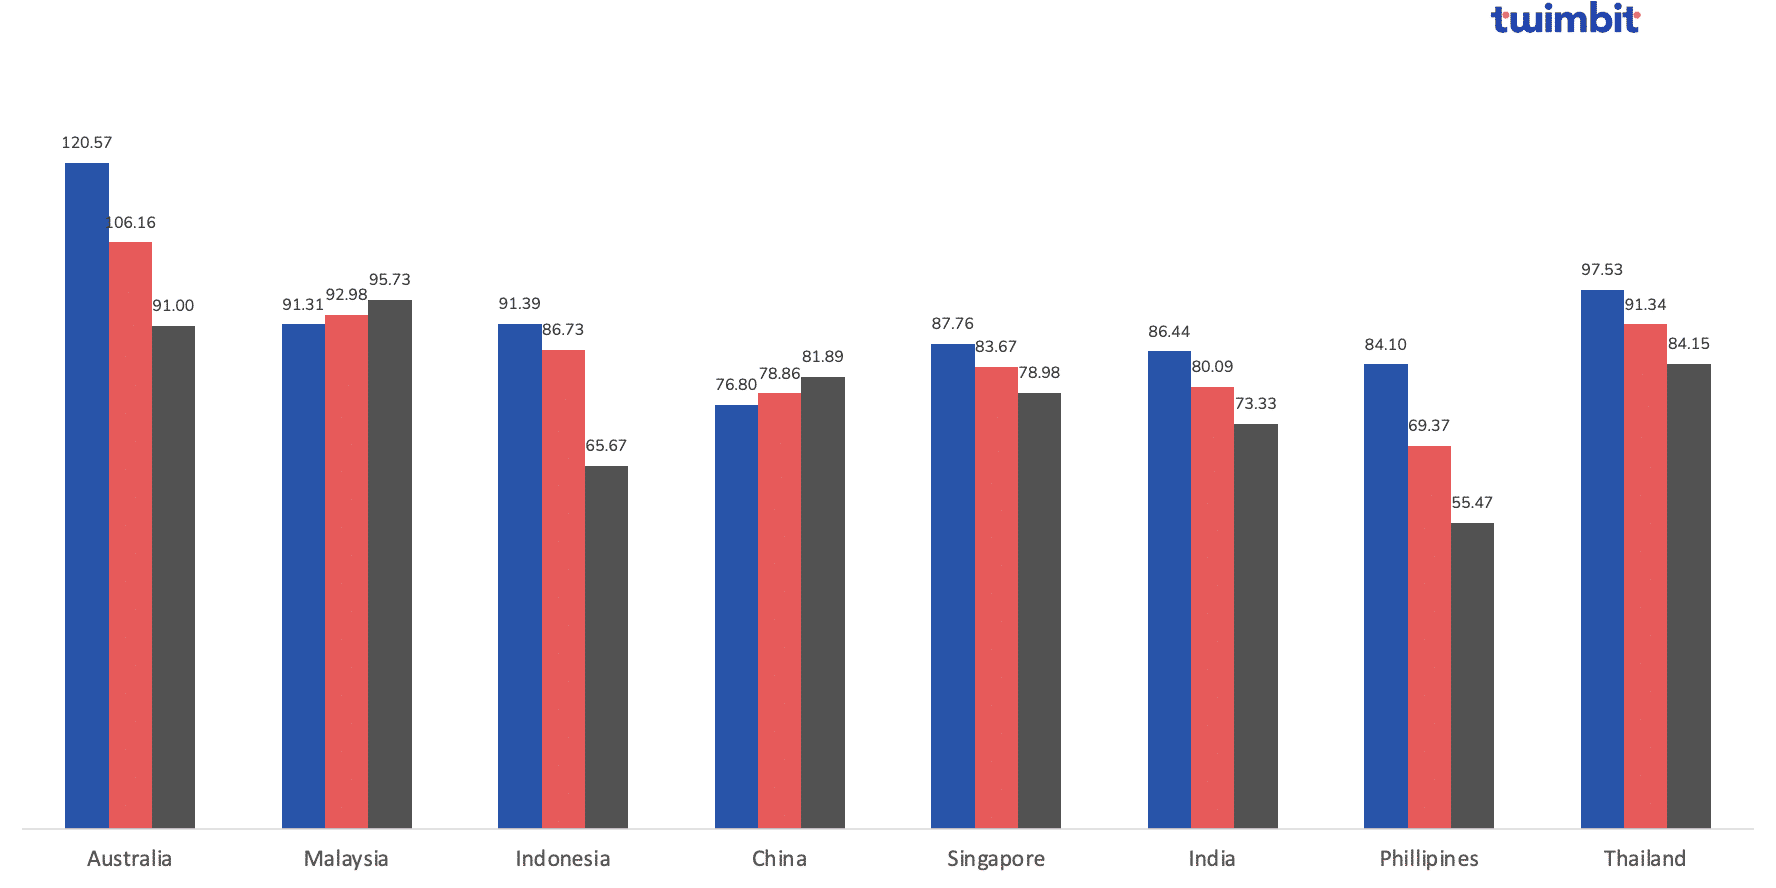
Changes in Loan-to-Deposit Ratio from 2018 to 2022, forecast for 2027
The average loan-to-deposit (LDR) ratio for APAC banks has declined by a CAGR of 1.65% from 92.67% in 2018 to 86.57% in 2022. Of the 41 banks analysed, 30 recorded a decline in their LDR, 3 banks witnessed a growth below 1%, and the remaining 8 saw growth above 1%.
The threshold of an ideal LDR is between 80-90%. However, apart from Singapore, India and the Philippines, all other countries had average LDRs outside the range in 2018. In 2022, only Singapore and India could maintain the ratio within the threshold. Certain banks were also closer to the threshold range but just outside it.
- Australia
- Historically high LDR as loans comprise most of their total business.
- Strong credit demand in the Australian market, particularly for housing loans.
- Low-interest rates in recent years led to a borrowing surge in debt.
- Low-deposit rates, reducing customers’ incentive to save.
Australian banks are trying to get their LDR into the ideal range by growing their customer deposits at a rate higher than the growth in their loan portfolio. In some cases, the difference between the increase in deposits is up to 5% more than the increases in the loan portfolio.
High LDR for Australian banks puts them under pressure to maintain sufficient reserves that cover unexpected contingencies and cash runouts.
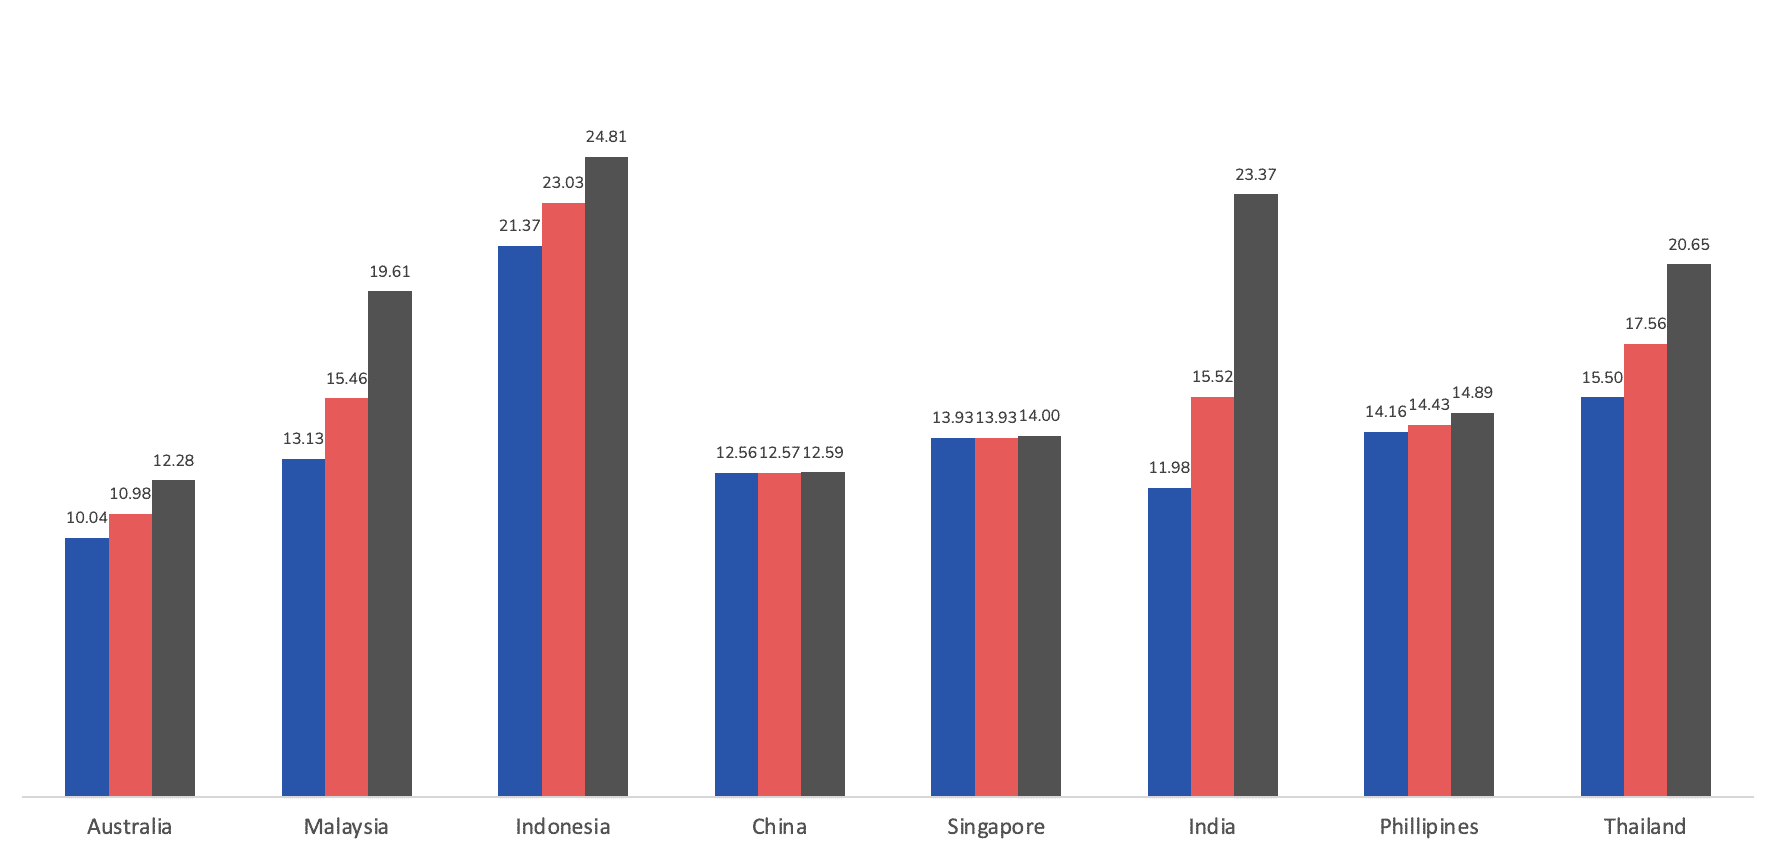
Trend #10 Improvement in asset quality post-COVID-19 led to a 1.66% fall in the non-performing loans for APAC banks
Changes in Non-performing loans from 2018 to 2022, forecast for 2027
The current average non-performing loans (NPL) ratio for the top 41 banks in APAC stands at 2.14%, down from 2.73% in 2018. On the other hand, 5 of the 41 banks analysed recorded double-digit growth in their NPLs.
Meanwhile, as a whole, the developing nations in Southeast Asia were the most affected by the pandemic, leading to increased NPLs due to late repayments and defaults. However, Indian banks have come on top with a 9.88% CAGR reduction in their NPLs. These banks are expected to improve their NPLs further. SMEs and low-income households are vulnerable amid high inflation and rising interest rates. However, the impact will be limited.
- Australia
NPL in Australia has inherently low NPL because of:
- Sound lending policies
- Superior underwriting
- Stringent credit checks
Despite this, the financial system could withstand the expected rise in household NPLs with the help of low-interest rates, loan repayment deferrals and government stimulus. As a result, the NPL for Australian banks is likely to stay constant without much shift.
- Indonesia
NPLs in Indonesia have been relatively high recently because of:
- Slower economic growth impacts borrowers’ ability to repay loans.
- Tighter loan classification standards and increased reporting requirements
- The Philippines
The Philippines tends to generate high NPLs because of:
- A large informal economy that causes verification issues of borrowers’ incomes and creditworthiness.
- The unavailability of collaterals
Because of this, the country’s banks struggle to recover their loans in case of a default, thereby running a higher risk of increasing NPLs.
- India
Indian banks have improved their NPL with:
- Improved credit appraisal and monitoring to identify potential NPL early and apply corrective measures
- Stringent credit checks to assess applicants’ creditworthiness and risk of default
These initiatives help India to avoid disbursing loans to applicants below the acceptable credit risk level.
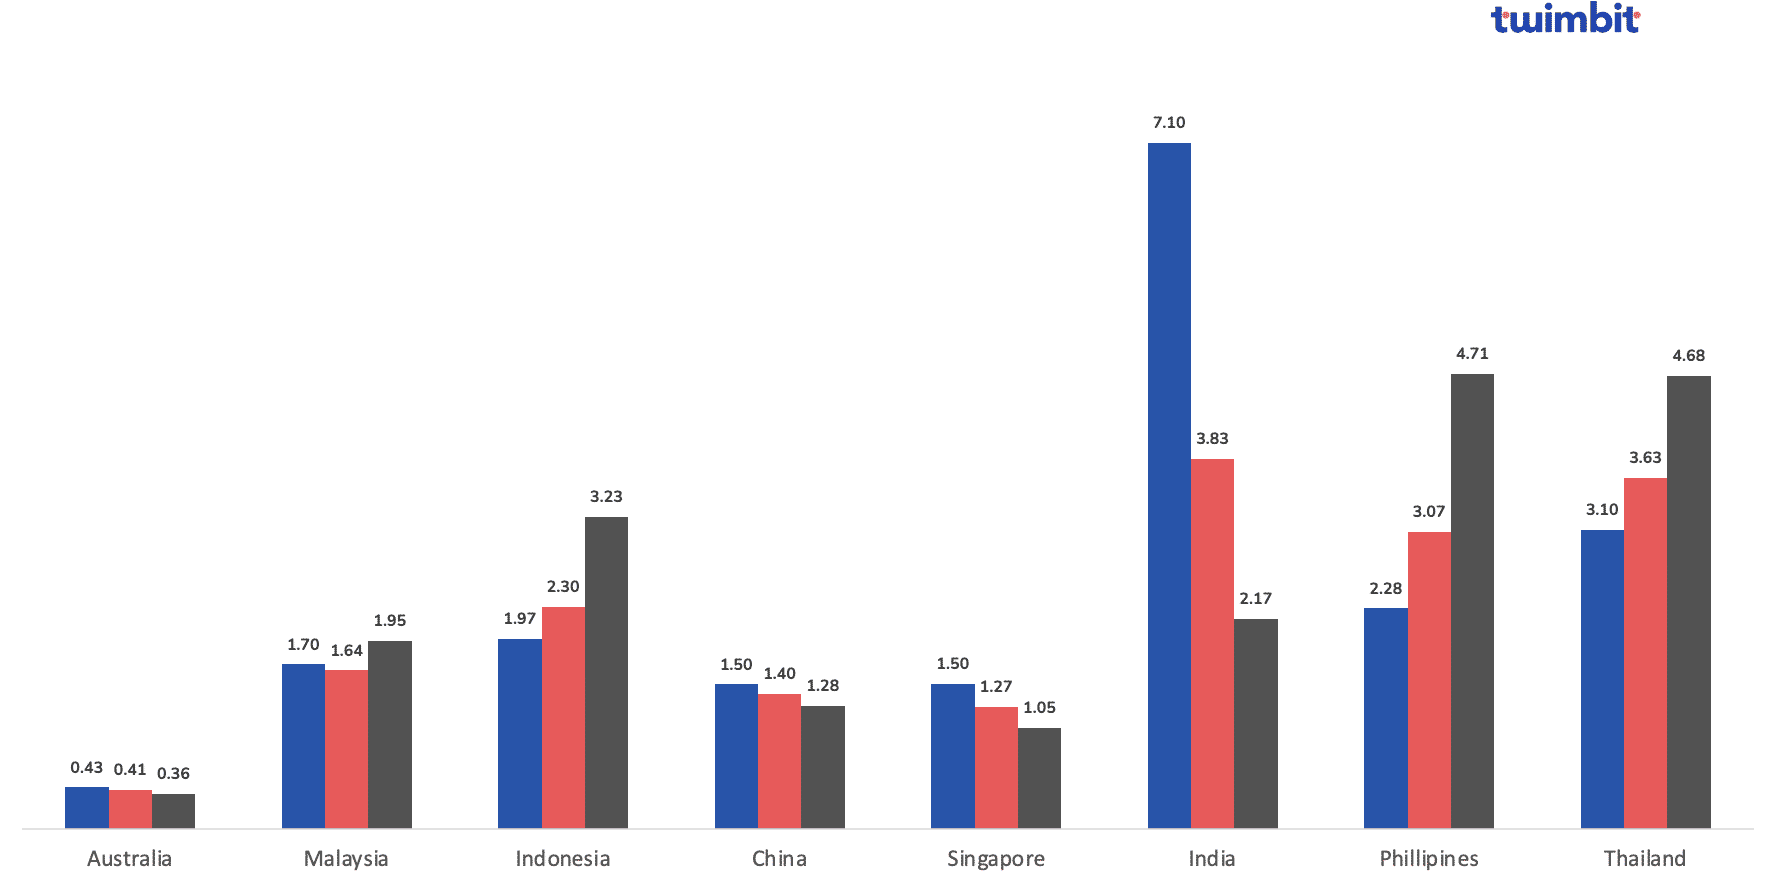
Trend #11 Efficient use of assets helped APAC banks grow their return on assets by 5.2% annually
Changes in return on assets from 2018 to 2022, forecast for 2027
The average return on assets (ROA) for APAC banks is 1.46% in 2022. ROA is a measure of the bank’s profitability concerning its total assets. Since banks are highly leveraged, a relatively low 1-2% ROA may represent substantial revenues and profits.
- Axis Bank
The bank achieved a ROA growth of 134.52%, from 0.04% in 2018 to 1.21% in 2022. Aside from that, we predict that ROA for Indian banks will grow at a CAGR of 3.35% to 1.71% by 2027.
- RHB
RHB had an impressive ROA of 7.58%* in 2022 which resulted in a growth of 65.93%. Although impressive, it might be difficult for the bank to maintain such a high ROA, which will likely decrease in the following years.
How are banks improving their ROA?
- Increasing lending rates
- Improving the deposit mix
- Reducing reliance on expensive wholesale funding
- Enhancing asset quality to reduce provisional requirements
- Increasing the fee income through expansive product offerings and cross-selling
As a result, the banks can increase their net interest income, improving their ROA and profitability.
*Note: RHB calculates its ROA by dividing total gross income by the average amount of assets funded by URIA. However, due to such a discrepancy in the ROA for RHB compared to other banks in the region, the ROA was calculated using the standard formula of dividing net income by total assets.
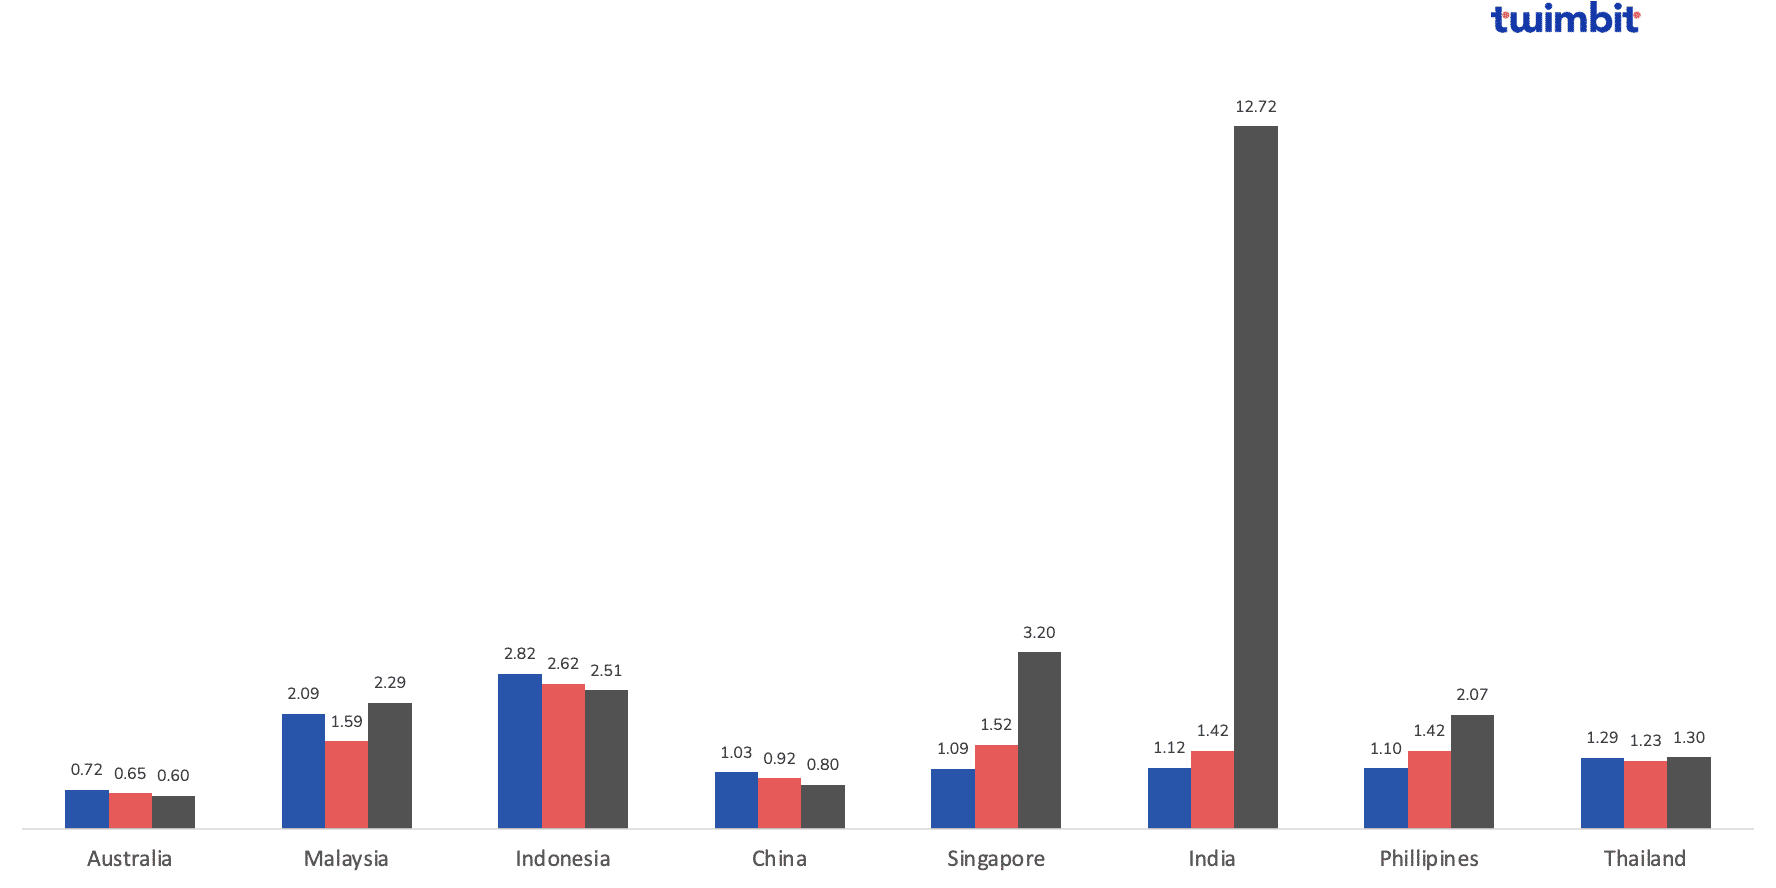
Trend #12 APAC banks are increasing their uncertainty buffers with an annual increase of 2.95% in their Common Equity Tier – 1 ratio
Changes in common equity tier–1 ratio from 2018 to 2022, forecast for 2027
The average common equity tier-1 (CET-1) ratio for APAC banks was 15.56% in 2022, up from 13.85% in 2018. Out of the banks analysed, 80% recorded a growth in the ratio. However, all the banks could maintain the ratio above the threshold value of 4.5% between 2018 and 2022.
Maintaining a healthy CET-1 ratio implies that the bank can absorb a financial shock easily and will not be required to be bailed out, as in the event of a crisis, equity is taken first from tier 1.
Recently, HDFC Bank announced its merger with parent company HDFC Corp. Ltd which is scheduled to be completed by July 2023. To meet its capital requirements and other prerequisites stipulated by the regulator for its merger, HDFC is raising USD 6.08 billion (50,000 crores) by issuing Perpetual Debt Instruments. This includes additional Tier I capital, Tier II Capital Bonds and Long-Term Bonds for infrastructure and affordable housing.
To know about the State of Australian Banks in 2023, click here.
To know about the State of Malaysian Banks in 2023, click here.
To know about the State of Indian Banks in 2023, click here.
To know about the State of Singapore Banks in 2023, click here.
To know about the State of Vietnamese Banks in 2023, click here.
To know about the State of APAC Banks in 2023, click here.